I’ve spent the past year at Hawk Ridge Systems visiting customers around Southern California in my 2000 Volkswagen Beetle TDI. The ride is great, and so is the mileage. Unfortunately, I’ve noticed the car is experiencing power loss at low RPMs, something that 1.9-liter turbo diesel engine shouldn’t have an issue with.
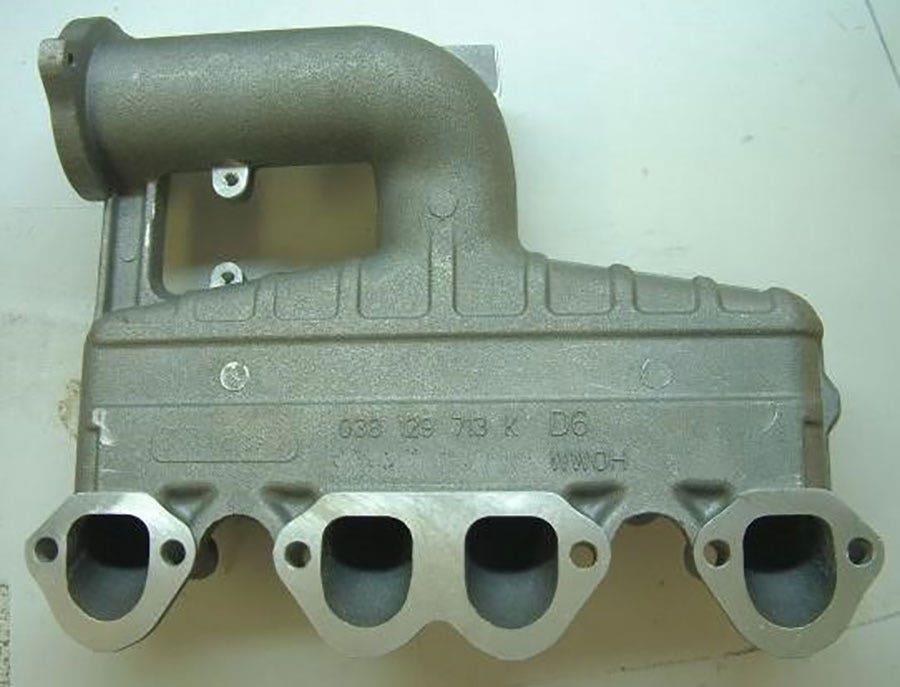
After a bit of research, I came across a suggestion that power loss could be caused by years of soot build up clogging the intake manifold.

Removing an/or replacing the intake can unfortunately cost several hundred dollars and many hours of labor. So, although SOLIDWORKS is normally used as a design tool, I decided to model the intake, add some carbon build up, and compare these potential states of sickness with the computational fluid dynamics capabilities of SOLIDWORKS Flow Simulation to see if that would be worth the time and cost.
Modeling the Intake
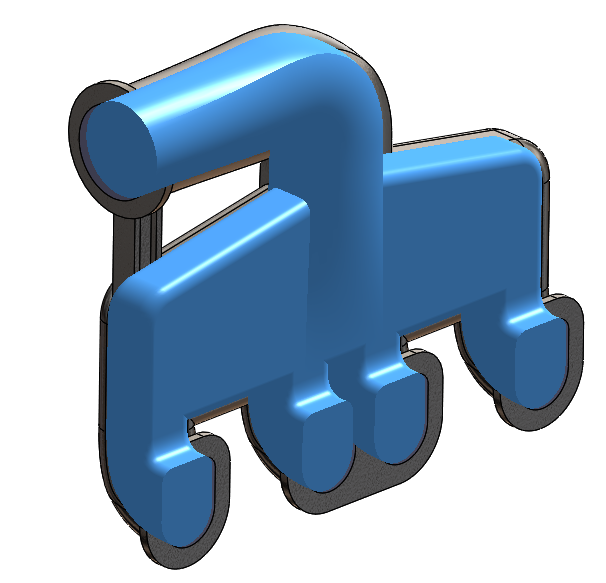
First, I needed some geometry, so I started by looking up a few images so I could create the .SLDPRT file.
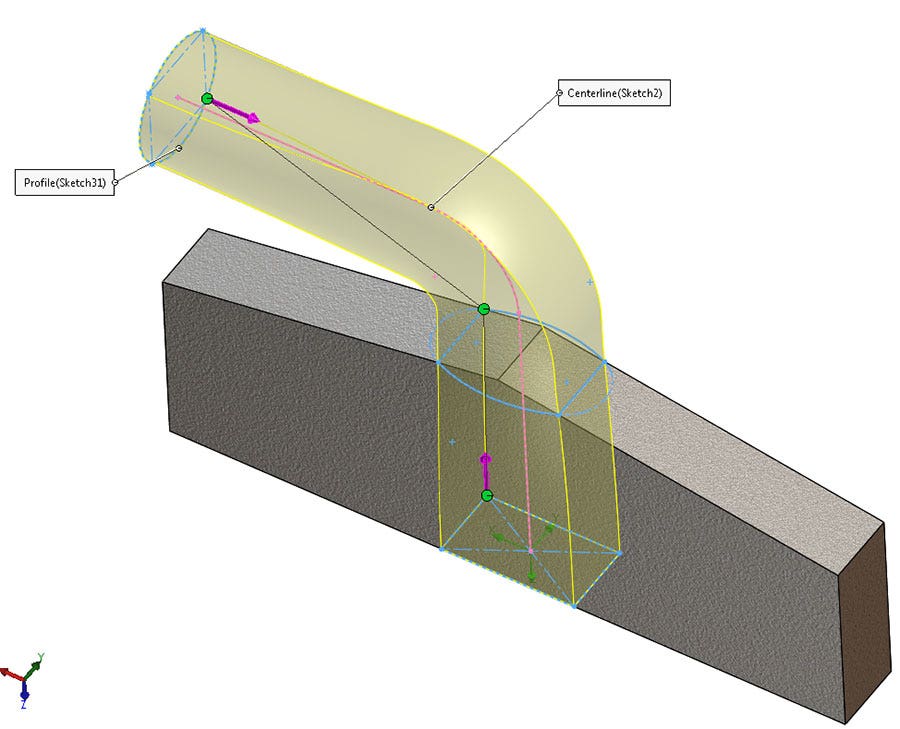
For accurate geometry, I could partially disassemble my engine and generate cloud point data with an Artec 3D scanner, but that would defeat the purpose here. Instead, I was able to model the inlet pipe in SOLIDWORKS with a single solid-body Loft feature, using multiple sketch profiles and the Centerline Parameters option.
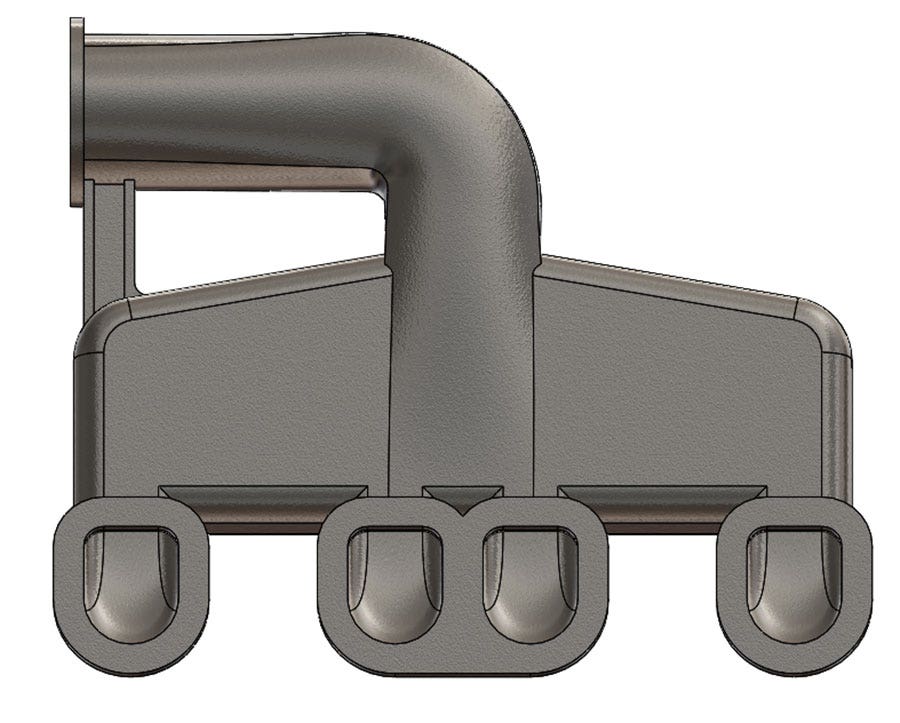
After a few fillets and other features, the main shape was nearly complete. The last task was to add a Shell feature to hollow out the body, followed by some finishing touches like the mounting flanges and holes.
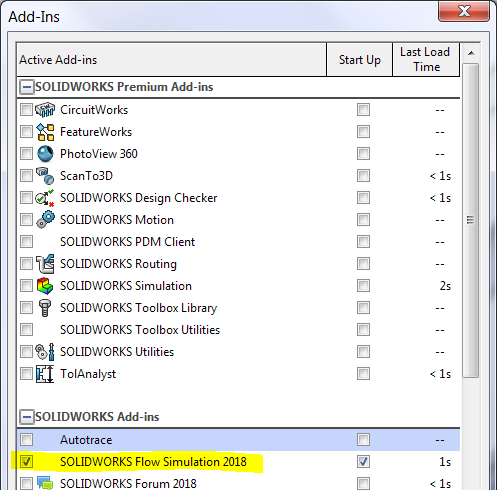
SOLIDWORKS Flow Simulation can analyze any solid geometry, even file types such as STEP or IGES, so this solid model is nearly ready for analysis right from the start. It’s simply a matter of clicking Tools > Add-Ins and checking the appropriate box on the left.
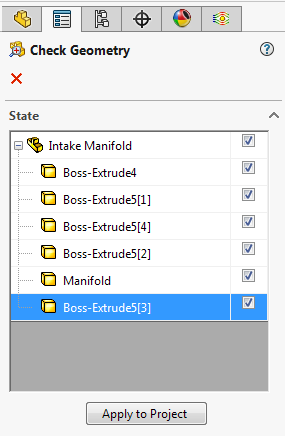
Since I only care about the airflow inside this manifold, an internal analysis is appropriate, which means that the only required geometry preparation is to seal up the openings at the inlet and cylinder ports, using either the Create Lids tool, or a few Extruded Boss features. These lids will allow SOLIDWORKS Flow Simulation to recognize the fluid volume for the simulation, and will also give me a place to click when defining the boundary conditions for my analysis.
I can verify I’m ready for my set up by using the SOLIDWORKS Flow Simulation Check Geometry tool, and clicking Show Fluid Volume:
To determine whether or not my intake is clogged, I’m going to first run a simulation assuming my car is clean, using some data (like manifold air pressure) that I’ve observed with my Scangauge II engine monitoring device.
Determining Input Conditions
The principle behind a turbocharged engine is that the turbo compressor can increase the density of the air going into the combustion chamber. The extra air molecules mean that more fuel can be injected as well, generating more power without more displacement.
If the carbon build up in the intake manifold is adding extra resistance, however, the turbo will need to use more of its pressure output to overcome those losses, and won’t be as effective at densifying the air, leading to power loss. The goal of my simulation then was to examine that density, or more specifically, the mass flow rate of air going into the engine.
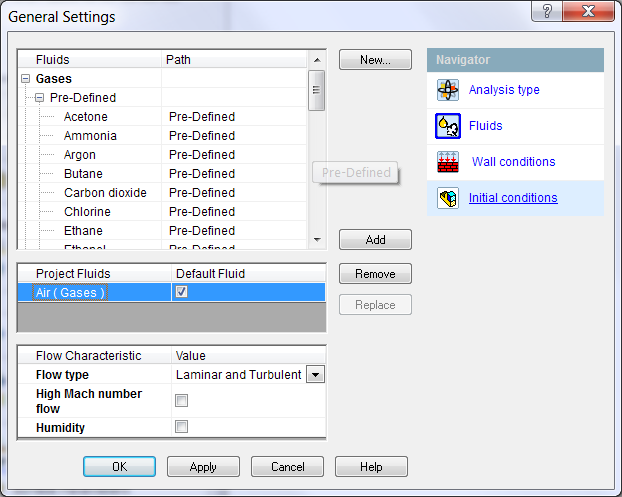
Getting started with my simulation is a matter of clicking through the Project Wizard to set basic conditions of the study, such as the fluid (air) and the ambient conditions (by default, standard temperature and pressure at sea level, otherwise known as STP).
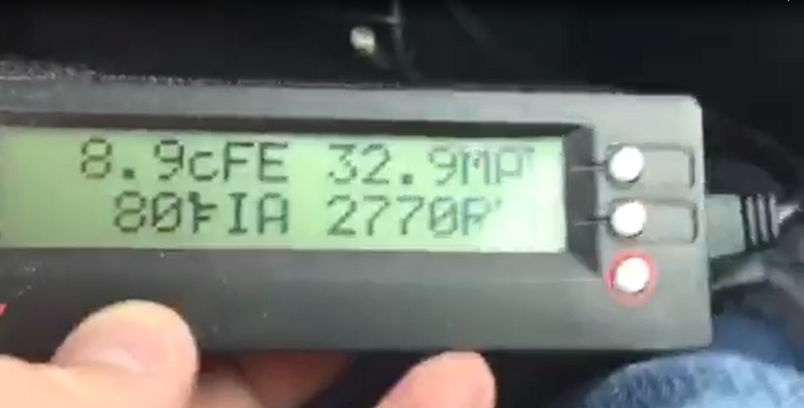
Part of the challenge in performing any simulation is determining which Boundary Conditions will best represent the real world. Should I try to define the velocity at the inlet? If so, which number would I type in? Thankfully, I have some information from Volkswagen’s engine specifications as well as real-time data from my Scangauge II engine monitoring tool.
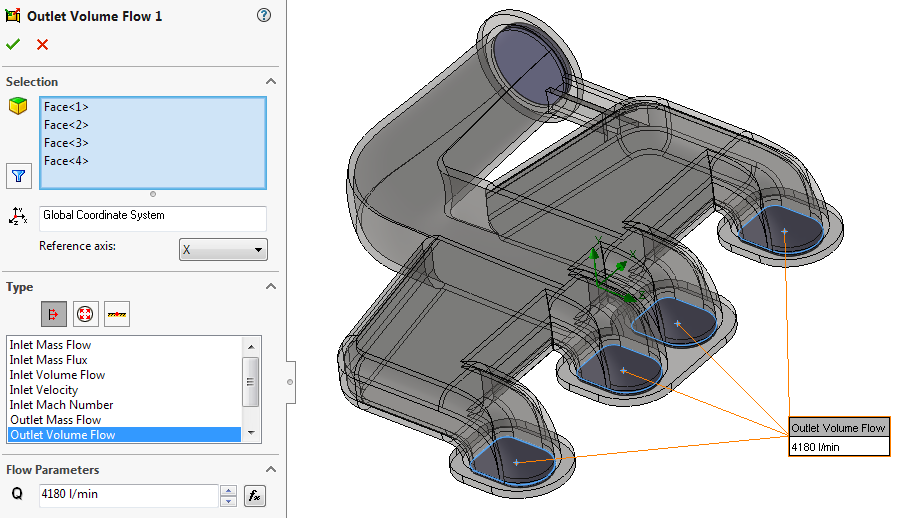
The displacement of the engine is 1.9 liters, which means with some simple arithmetic, we can calculate the volume flow rate of air going through the engine for a given engine speed. At 2,200 RPM, this works out to 4,180 liters per minute, which I can type directly into the Outlet Volume Flow condition thanks to SOLIDWORKS Flow Simulation‘s customizable units.
At the inlet to the manifold, I can define a pressure condition to mimic the amount of boost being provided by the turbo compressor. By looking at my Scangauge II while driving, I’ve observed that this tops out around 33 psi given an air temperature of 80°F. I also know that the pressure sensor on the Volkswagen ALH engine is similar to that of a pilot-tube, meaning it’s measuring the total pressure (also known as stagnation pressure) which accounts for the velocity and density of the fluid. SOLIDWORKS Flow Simulation lets me directly input that type of condition as well.
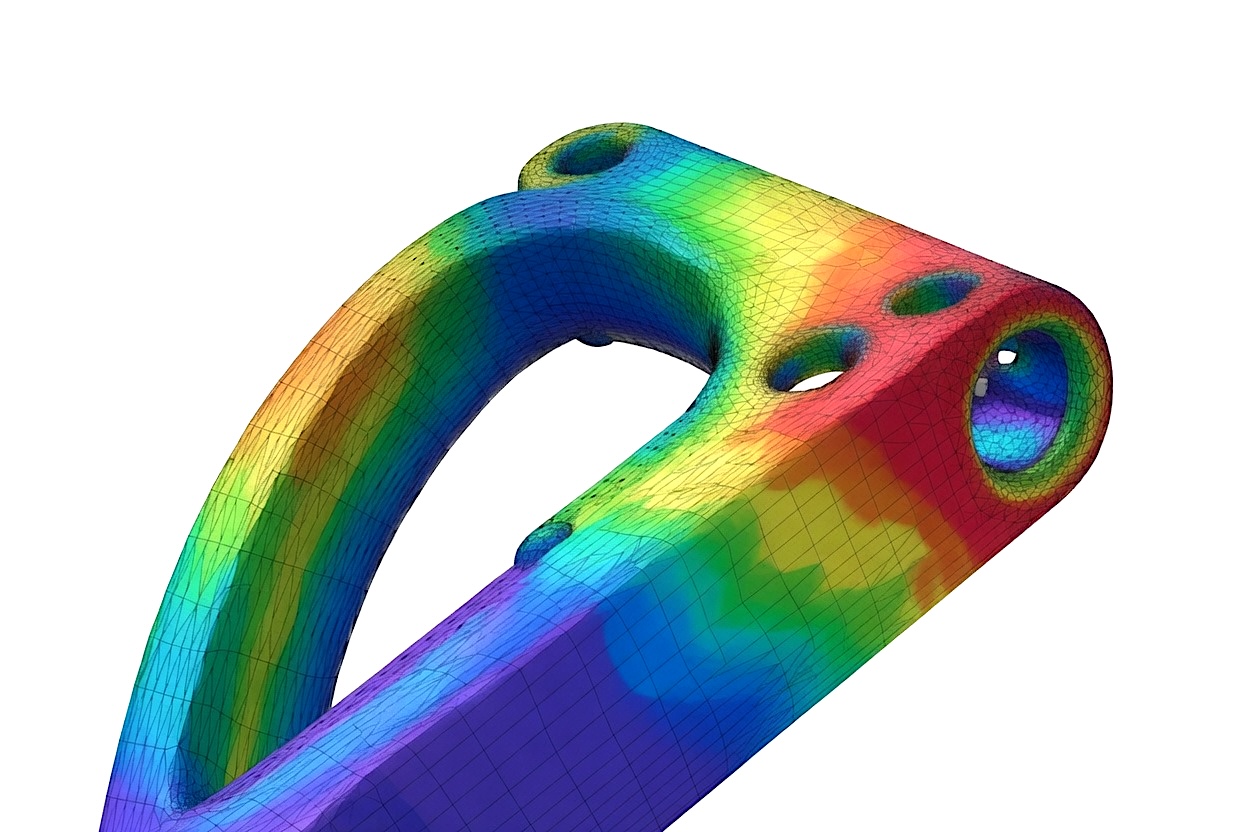
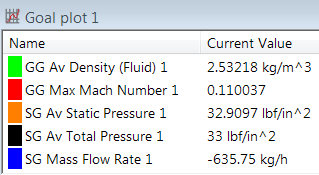
With these settings in place, and some Surface Goals applied to measure key results at the outlets, I’m able to run the analysis. Right from the solver window, I can observe that the simulation completes with an air mass flow rate of about 636 kg/hr. Likewise, I can see an air density of about 2.53 kg/m3, which is more than double the normal density of air at sea level!
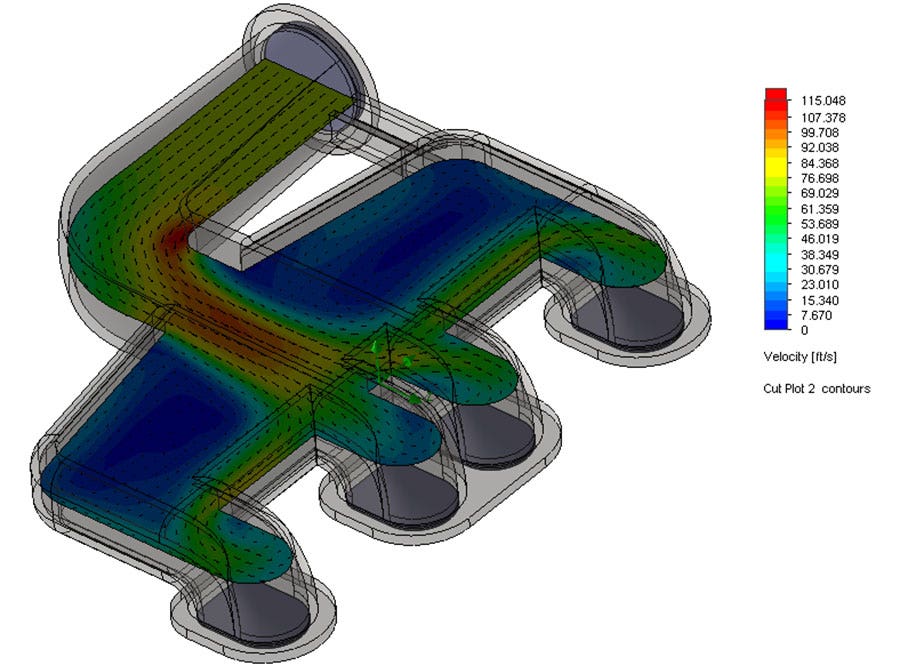
I can also use the visual results, like a Cut Plot, to examine other results such as velocity and the associated flow vectors, giving me confidence that my assumptions were correct. In this case, I can see a bit of swirl around the elbow bend as well as some dead zones in the back of the manifold. Interestingly, I can also see here that the airflow into each of the four engine cylinders is not particularly uniform – something that could perhaps be improved down the road.
Using Design-Validation Capabilities Inside SOLIDWORKS
Engineers who are familiar with computer simulation tools are probably used to the idea of having to begin a new analysis every time a different design is created. Even after all the work we have already done to make sure our simulation had realistic assumptions, repeating the setup clicks would be a poor use of our time. Luckily, thanks to the CAD integration of SOLIDWORKS Flow Simulation, that won’t be necessary.
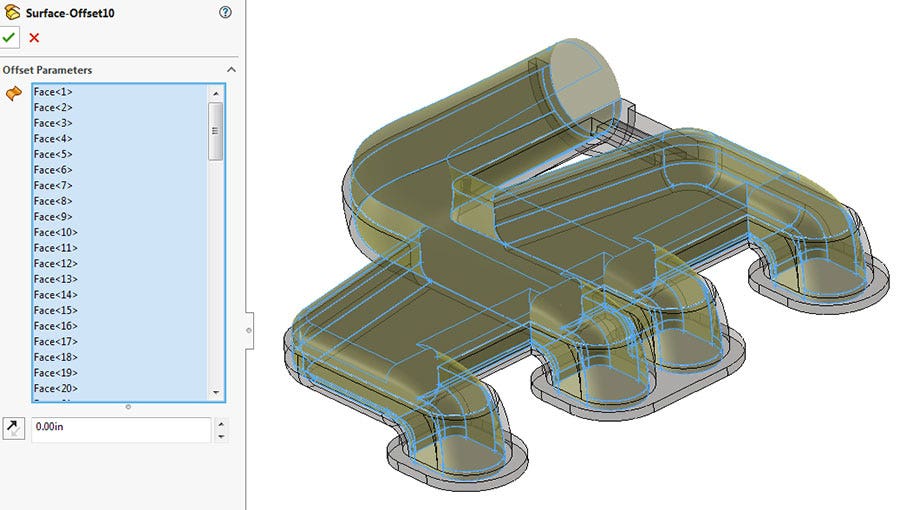
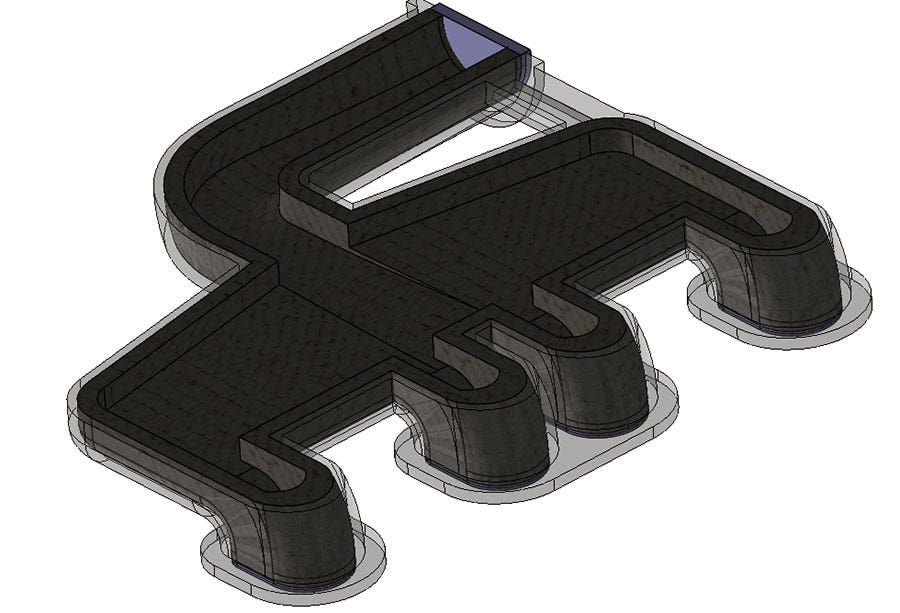
The only extra work needed for comparing the dirty and clean intakes will be to create a new Configuration of my part file and add some features to represent the soot. SOLIDWORKS makes that process easy too. After clicking Add Configuration, I decided to make a Surface Offset feature on the inside faces of the intake, followed by a Thicken feature which will make it easy for me to change the amount of the soot buildup down the road by modifying a single dimension.
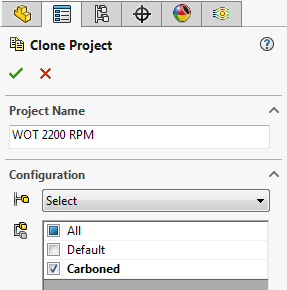
Now that the soot geometry is in place, I can go back to the Flow Simulation Analysis tab, and use the Clone command to copy my project (with all intended setup) to this new Configuration. All of my setup and boundary conditions are preserved, which means I can immediately click Run to solve this new analysis.
Once complete, I can examine all the same results as before- but my real interest is whether anything has changed compared to the clean design. This is a great chance to use the Compare Results functionality which can display the Goals and result plots of these simulations side-by-side.
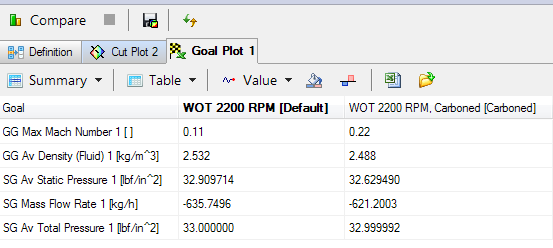
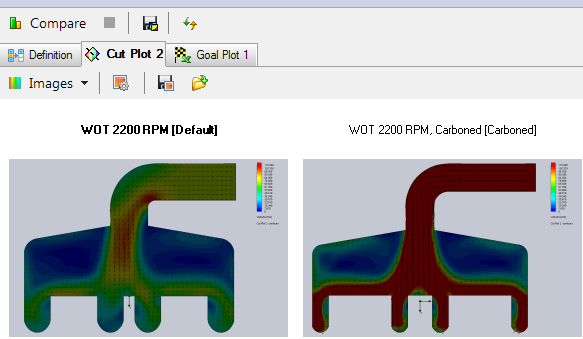
When I examine the results, I can see that the velocity of the air has greatly increased in the intake with carbon build up due to the reduced cross sectional area of the manifold- something that should be an expected result for those of you familiar with the Venturi effect. What is perhaps less expected is that the density of the air, and the resulting mass flow rate into the engine, has only gone down by about 15 kilograms per hour- a change of only about 2.3 percent. This suggests that the amount of pressure being supplied by the turbo (33 psi) is still high enough to overcome the added back pressure from this carbon buildup and compress the air accordingly.
But what about at higher flow rates? Perhaps the soot buildup is actually more of a problem at the top end of the TDI motor’s RPM range. The ALH engine in the 2000 Beetle red-lines at around 5,000 RPM, and since that is the condition that drove our original Outlet Volume Flow assumption, testing this situation is an easy task. We can take advantage of the Clone command two more times (once each for the clean and dirty intakes), increasing that outlet flow rate value to 9500 L/min. I can then run these new projects simultaneously using the Batch Run functionality, and upon completion, revisit the compare tool.
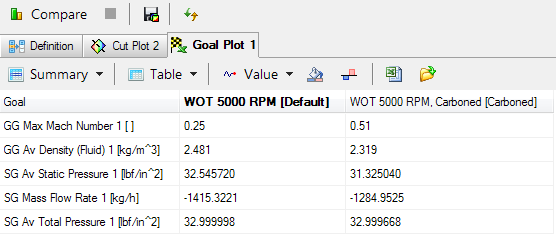
Now that’s a difference! At 5,000 RPM adding the restriction from the carbon soot drops the mass flow rate of air by nearly 10 percent, which suggests that the turbo compressor simply can’t generate enough boost pressure to both compress the air and move it through the clogged intake at this rate.
Is this the source of my car troubles? Of course there’s only one way to know for sure, but most of the power loss I had been noticing was in the low-end of the RPM range, the reason I started my initial test at 2200 RPM in the first place. My simulations just proved that even if my intake really is clogged, it’s probably not the cause of the issue I had noticed while driving.
Based on this information, I did some more research and determined that another possible culprit could be sticky vanes in the turbocharger which prevent it from spinning up freely, an issue which can be remedied much more easily. Thanks to the insight I gained from SOLIDWORKS Flow Simulation, I avoided replacing my intake manifold, which saved me at least a few hundred bucks and a Saturday afternoon.
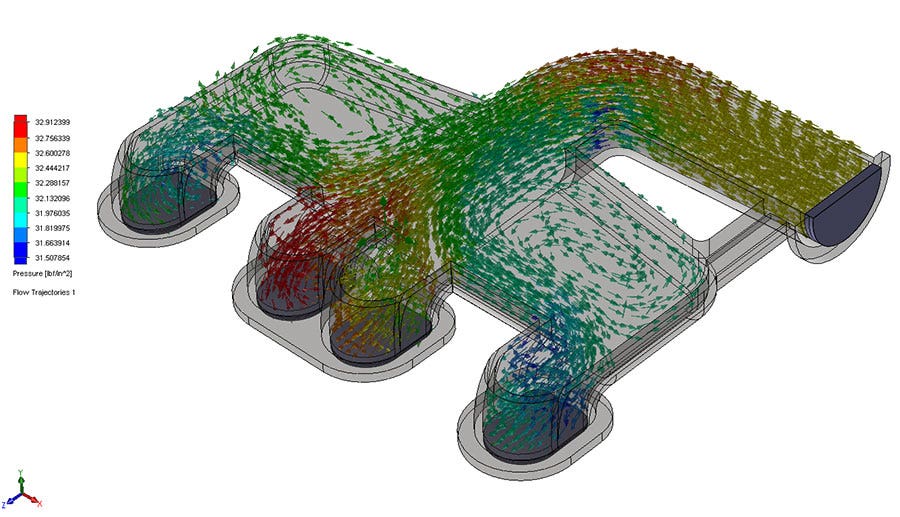
Of course, simulations like these could become even more valuable if I decided to develop a new aftermarket version of the intake. Detailed results like the Flow Trajectories plot lead me to believe that changing the manifold geometry might eliminate some of the dead zones in the intake and reduce the air density loss at high flow rates. I could even take advantage of the Parametric Study functionality to automatically run my simulation and adjust certain part dimensions until it finds the shape that has the least back pressure. I could then export that optimized design directly to a 3D printer for some final real-world bench testing, and maybe even a sale.
Visit our website to learn more about how 3D design and validation tools can help your engineering processes, or contact us at Hawk Ridge Systems today. Thanks for reading!