It’s Okay to Assume in SOLIDWORKS SIMULATION
Is it really true what they say about assuming? Well, in engineering, not really. In fact, assumptions when creating a design are necessary—as long as you keep them to a minimum.
In engineering practice, assumptions are used to simplify a problem to get to a solution faster and with less difficulty. Sometimes assumptions come at the cost of accuracy, but understanding the pros and cons of each assumption can help you make the best decision. In this blog, I am going to solve a practical problem in four different ways, making some different assumptions to prove that if an assumption is valid and you understand the consequences of the assumption, you can arrive at an accurate solution.
Problem Statement: How can I find the maximum stress on a plate with a hole under tension?
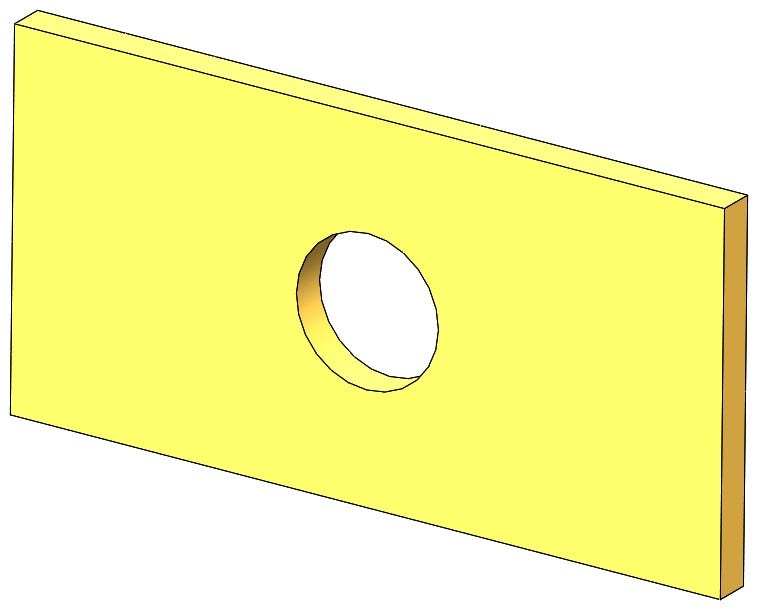
The problem I am going to solve is a simple plate with a hole in it under tension, with the goal of finding the maximum stress in the plate. I chose this problem because it is simple and even has a hand calculation solution that has its own assumptions. Figure 1 is the CAD model I will be using in SOLIDWORKS Simulation.
Ernst Gustav Kirsch’s linear elastic solution for stresses around a hole in an infinitely long thin plate uses a stress concentration factor to predict the maximum stress that will occur at the hole. This solution assumes that the plate is thin and “infinitely long” or that the plate is significantly longer than it is thick. It also assumes that since all the applied loads are in the planar direction the stress throughout the thickness of the plate will be the same, and the problem can be solved as a 2D problem. This methodology has worked for over 100 years proving that valid assumptions can yield accurate results.
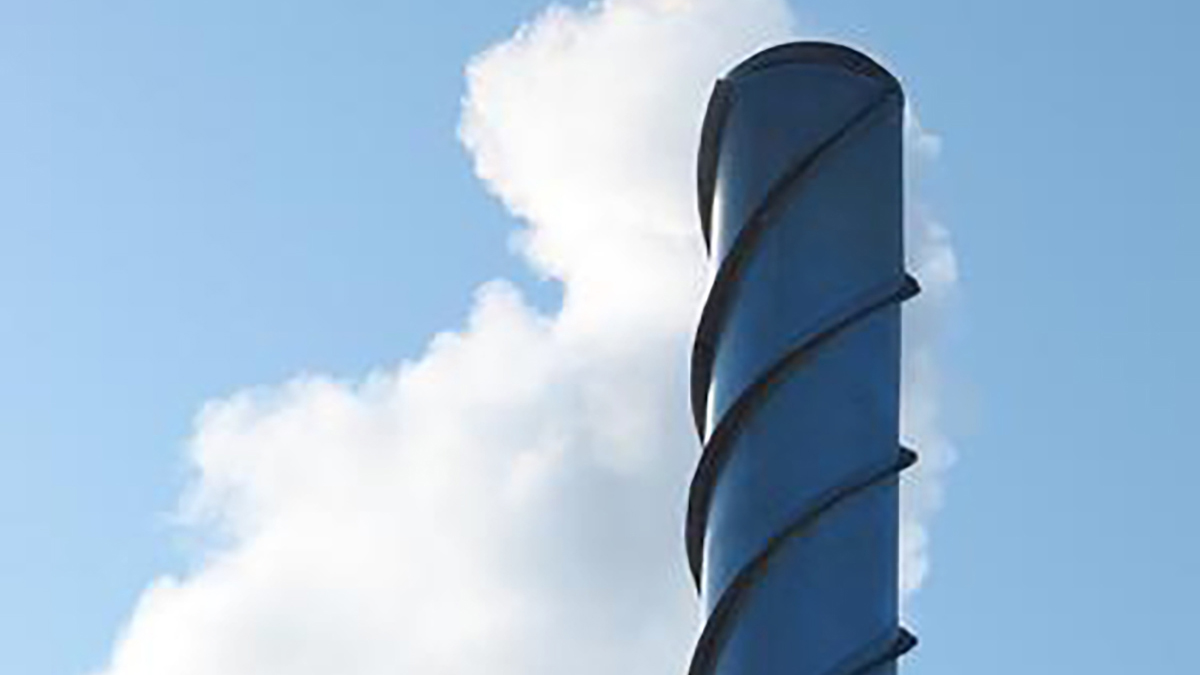
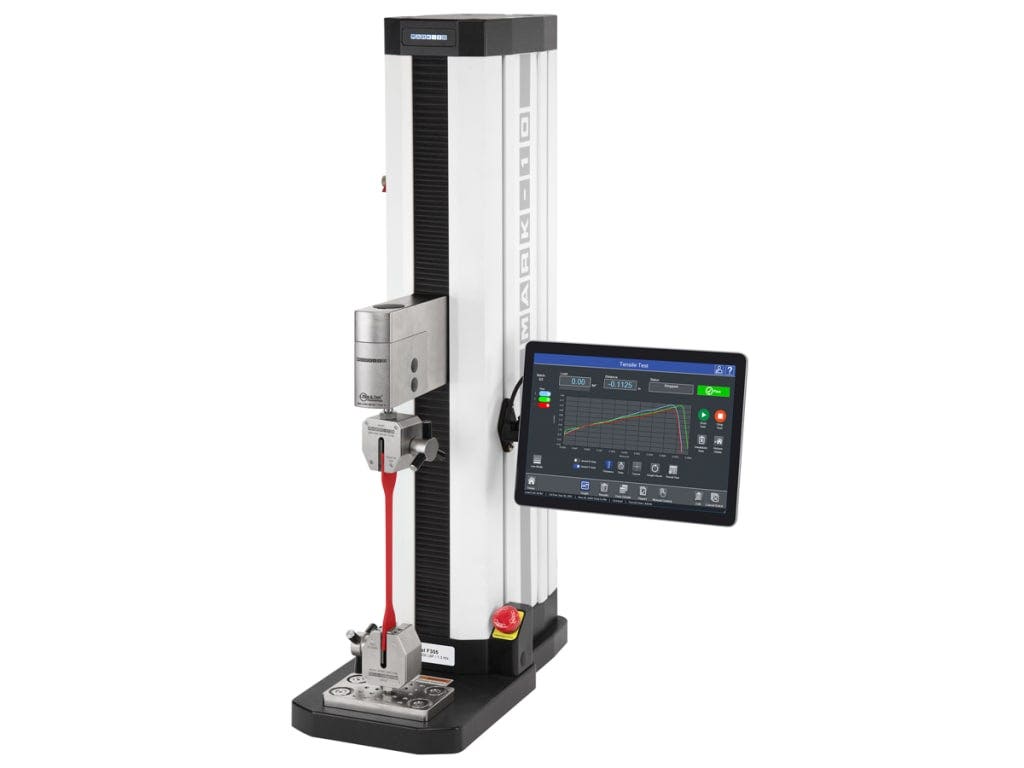
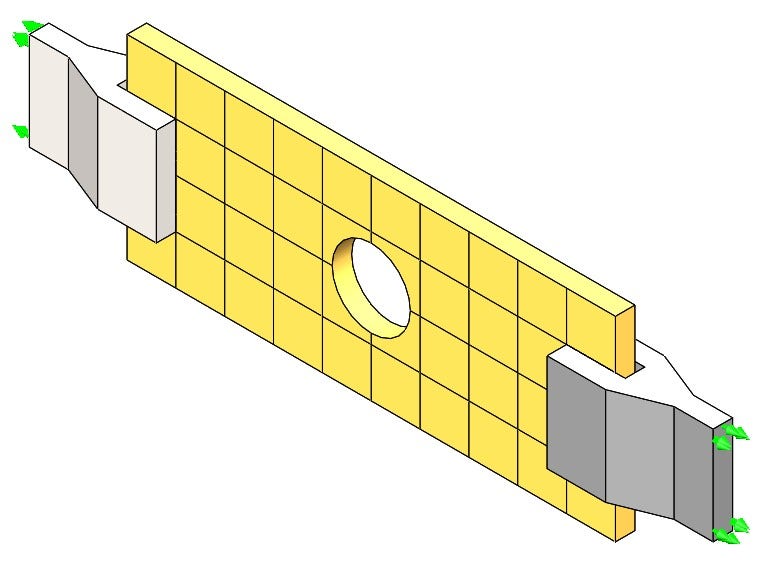
To approach this problem from a CAD perspective, I would like to imagine how the model is being loaded in reality. For my scenario, I am going to be putting this plate with a hole into a material testing machine like the one in Figure 2.
In my scenario, I am going to clamp the plate into the testing machine and apply a tensile load to find the maximum stress. There are many ways I can simulate this problem in SOLIDWORKS Simulation depending on the assumptions I want to make. The next sections are going to be four different scenarios using different assumptions to hopefully come to the same conclusion.
Scenario #1: Cropped Body with Distributed Force and Fixture
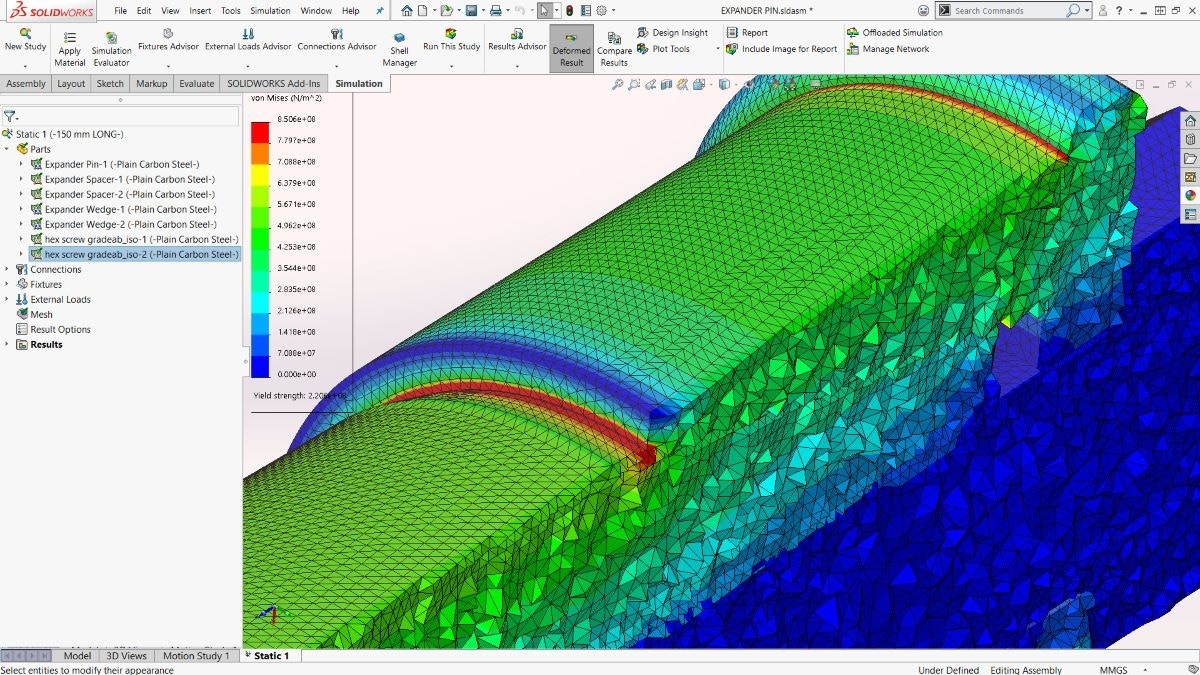
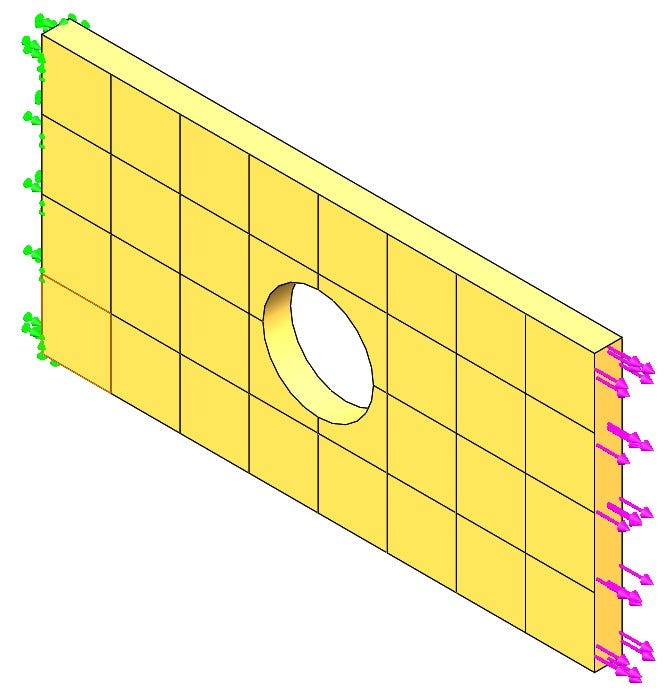
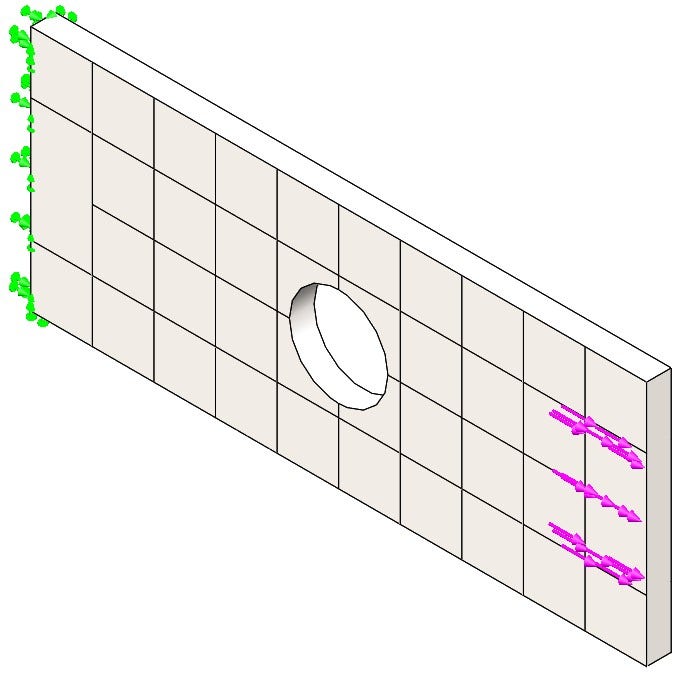
For my first scenario, I assume that stress is going to be the highest at the hole because of Kirsch’s theory mentioned earlier. With this assumption, I can remove the testing apparatus from the simulation and replace it with a tensile force and fixture. Removing all the extra bodies and contacts will significantly reduce the complexity of the problem giving me a faster solution. Since I am ignoring the effects of the clamp, I will also reduce the area of the test plate where the clamp will be contacting and only simulate the region where the stress has developed in the plate. This approach is similar to the infinite length assumption that Kirsch made. I will use a fixed surface to replace the clamp at the bottom and a force for the clamp at the top because that is how the machine is operating. The final setup for the simulation looks like Figure 3, but note the grid system displayed is not the mesh just a topological change on the model to probe specific locations for comparison.
The boundary conditions also make some assumptions. The fixture assumes that all the selected nodes do not displace, and the face does not deform. This will artificially stiffen the material in that region and induce some local error. Whenever you are using fixtures, you want to ensure that it is far enough away from an area of interest, so the induced error does not affect your desired results. This phenomenon is proven in Saint-Venant’s Principle. We will see from the results that the error induced by the fixture is far enough away from our area of interest (the hole).
The applied force has some assumptions as well. It is assumed that the applied tensile load is fully developed from the clamping face, so it is distributed across the face as a tensile force. Hopefully, the simplified model is cut far enough away from where the clamping force is applied that this assumption is true.
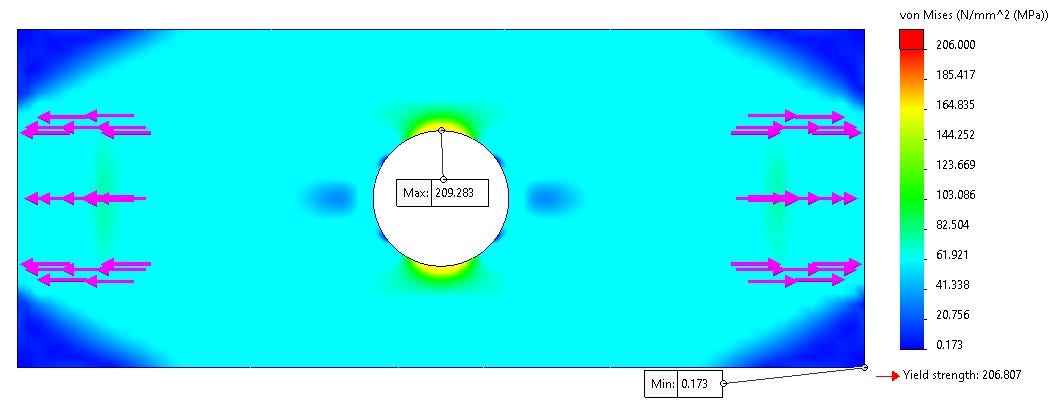
Scenario #1 Results: Maximum Stress Occurs in the Cutout
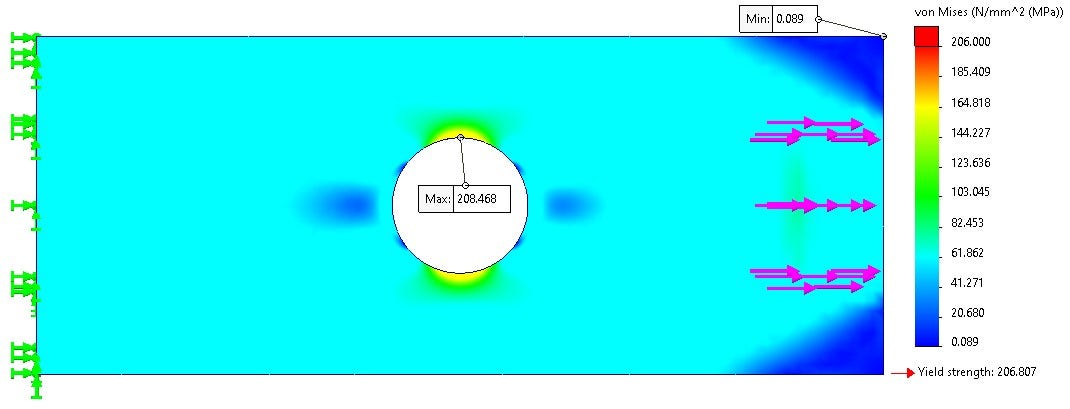
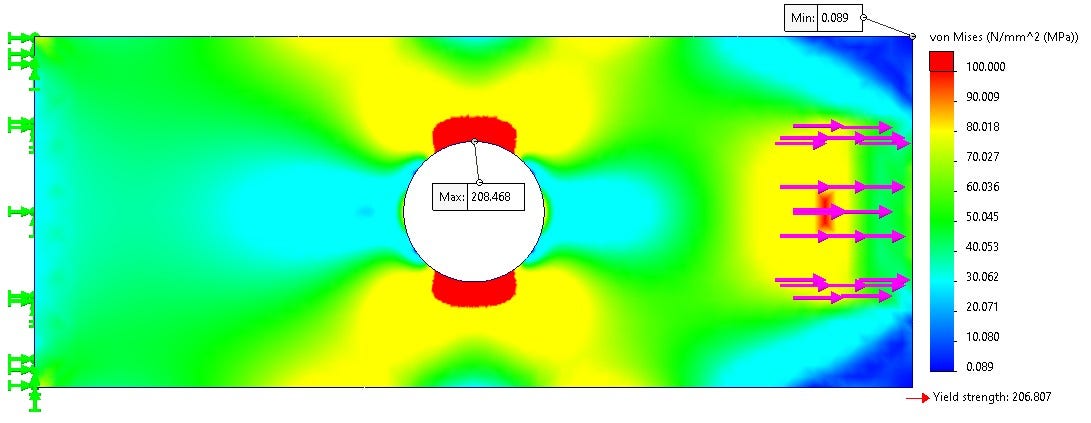
The results from scenario 1 are shown in Figure 4. We can see that the maximum stress occurs in the cutout. A region of compression occurs at the sides of the circle, and then the stress stabilizes as it approaches the boundary conditions.
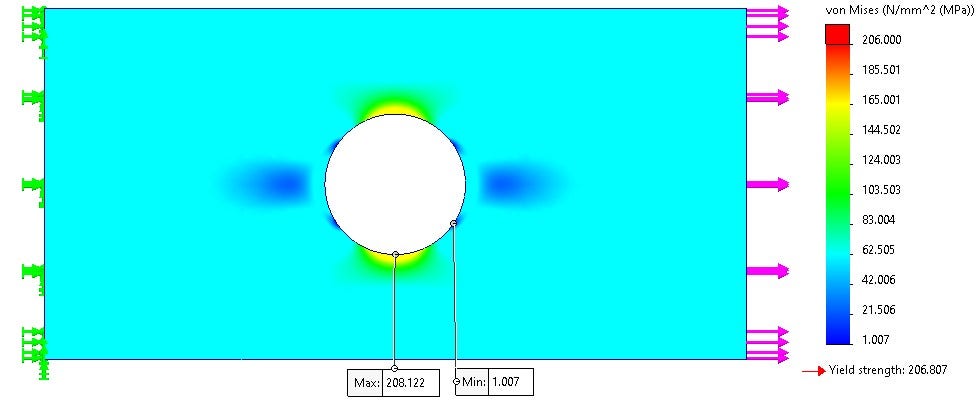
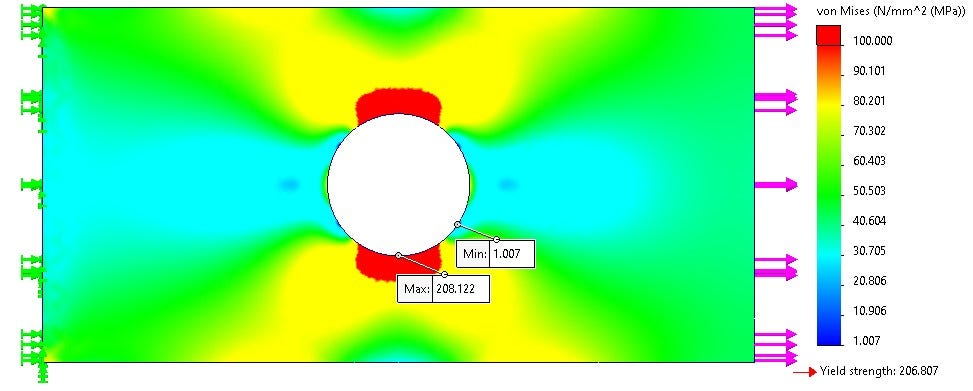
Changing the scale of the plot in Figure 5 we can see more detail of the lower stresses in the plate. On the force side, the stress concentration at the hole blends to a constant value and is one color through the length of the plate validating our infinitely long plate assumption. Read more about Von Mis stresses.
The boundary cut is far enough from the hole that the stress field can fully develop, and the boundary is not inducing any error. The same can not be said about the fixture at the other end. The fixture is artificially stiffening the material and the stress field is different. Comparing the symmetry of the results the fixture’s influence is not affecting our area of interest, so it is a valid assumption for this model. If my results looked asymmetric near the hole, I would need to cut less of the model to keep the fixture further from my area of interest.
Looking at these results, my three assumptions look valid and gave me a simple model for simulating. I can conclude that I would have some yielding in the region of the hole.
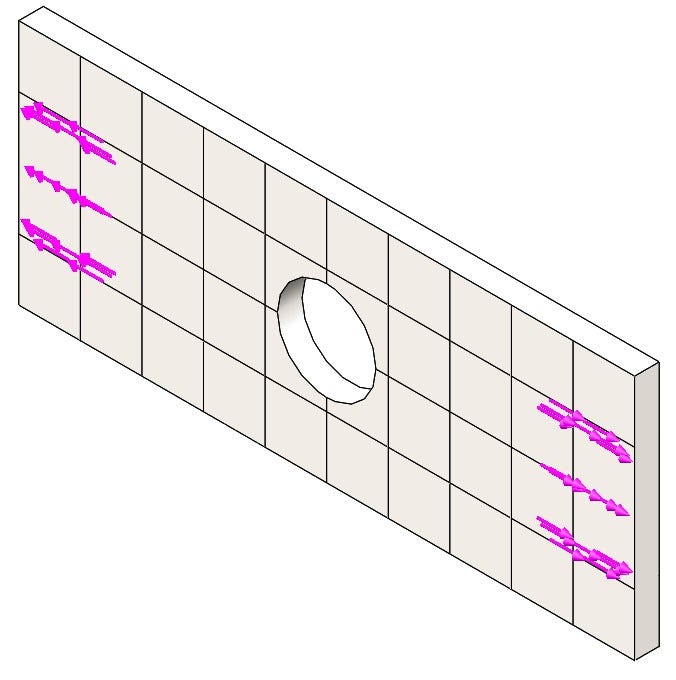
Scenario #2: Full-Length Body with Distributed Fixture and Targeted Shear Force
Another approach I could take would be not to use the infinitely long assumption and model the plate in its entire length. The boundary conditions would be similar to the first approach with a fixture at one end and a force at the other as seen in Figure 6. Since the area where the clamp is going to be applied is being simulated, a specific face has been created to apply the force. The same assumptions for the fixture apply but the force is assuming that there is no slip between the plate and the clamp and there is no compressive force or deformation.
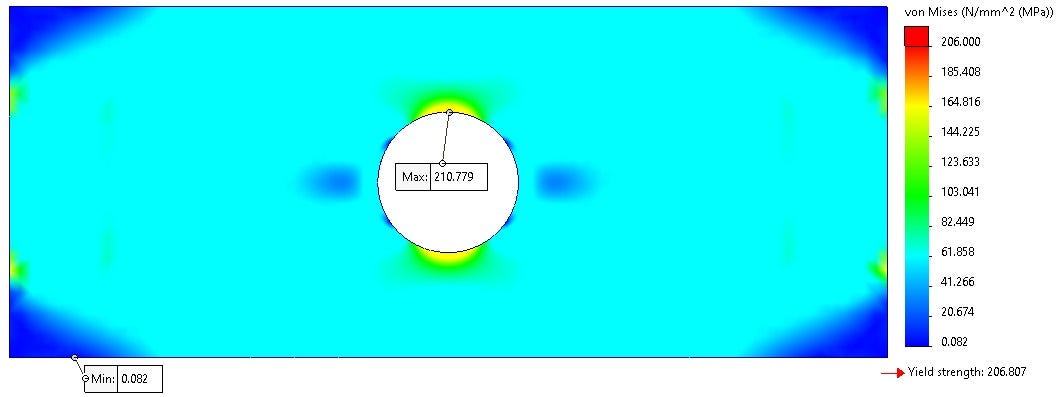
Scenario #2 Results: Differences Emerge as You Approach Boundary Conditions
The maximum stresses are the same in both scenarios but the differences in the results start to occur as you approach the boundary conditions. In Figure 7 we can see there is minimal stress in the corners on the side of the applied force. This occurs because of the smaller face used. The force is only applied to that localized region. Comparing the stress at the end of scenario 1 to the same location in scenario 2 we get around 61 MPa (Megapascal Pressure Unit). This further affirms the assumption of the stress being fully distributed in scenario 1. There is a slight stress concentration on the edge where the stress terminates but it is below yield. Maybe with a compressive force, this would escalate but that would be for another study.
Changing the scale in Figure 8 we better see the stress distribution in the plate. The two sides are not symmetrical near the boundaries but are symmetric in our area of interest (the hole). The side with the force has more stress in the “clamping” region and the fixture has some high stresses on the corners.
To find the stress in the hole, which is the intention of this simulation, these assumptions are valid and will allow me to conclude there will be some yielding in the hole. This approach took a little longer than scenario 1 because the larger model has more nodes. It is still a valid approach to solving this problem.
Scenario #3: Full Body Length with Targeted Shear Forces
Since fixtures artificially stiffen a model, scenario 3 will be the full length of the plate with shear forces used to represent the machine clamps. Since this simulation has no fixtures the inertial relief option was used to ensure no rigid body motion occurred. To use the inertial relief, an assumption of the applied loads being balanced must be made. In this case, that assumption is true, and the inertial relief will negate any numerical nose created from an asymmetrical mesh.
Scenario #3 Results: Stress Concentrates on the Hole
This simulation resulted in symmetric results with the stress concentrating on the hole as seen in Figure 10. The maximum stress is comparable to the other two scenarios and will cause material yield. The high stress in the corner of the plates caused by the fixture is removed but we can still draw the same conclusions from this study as we did from the rest. So, removing the fixtures increased the realism of the simulation but also increases the total degrees of freedom which increases the solve time—the balancing act of every simulation.
This approach resulted in a longer solution time than the previous scenarios but gave a more realistic stress distribution near the clamp locations and ends of the model. Is the enhanced accuracy really necessary since the stress at the corners are near zero and the maximum stress causes the same conclusion?
Scenario #4: Full Body Length with Bonded Clamps
In this scenario the clamps will be modeled and bonded to the test piece and then displaced as seen in Figure 11. This setup requires a lot more degrees of freedom as there are more bodies to mesh. The clamps contact the same area that the shear force was applied to and are assumed to be perfectly bonded to the plate. The bonded assumption will negate the need for a compressive force and friction to connect the two bodies and the faces will stay in perfect contact without sliding, slipping, or separating.
Scenario #4 Results: Maximum Stress at the Hole
Looking at the results of just the plate as seen in Figure 12, it looks very comparable to scenario 3. The only difference is stress concentrations caused by the bonded contact on the edges of the plate. This simulation took the longest to run because of the higher mesh count and the component interactions that needed to be solved and calculated. The maximum stress is still at the hole and will still cause plastic deformation. So from all the studies so far, we are drawing the same conclusion.
With this approach, we can gain some new information like, how much force is required to pull the clamps (the “reaction force”), or how much friction is required to maintain the bond (the “free body force”). Since the problem statement only worries about hole failure, this information is not necessary to solve the problem at hand.
What can we learn about the scenarios we just tested?
You can continue to add complexity and realism to the design indefinitely. I could model the entire machine, add gravity, or add some temperature conditions if I am slightly off from standard temperature and pressure. The next step would be to add a contact interaction with friction and a compressive clamp force but that would just be a waste of time for this specific example as we have seen from this exercise. A more complex simulation does give us some better insight into other aspects outside of the problem statement like: “How the model will be compressed?” And “How much clamping force might be needed?”
However, this is extraneous information not needed for this study.
On the flip side, if you run into a problem where the assumptions for a single part cannot be well understood (suppose the load path is unclear or it’s difficult to do a free body diagram) then taking advantage of the assembly/contact capability can be valuable.
Assumptions can seem scary because you are losing a lot of realism in the simulations. If the assumptions are based on good engineering principles, you can get accurate results in a fraction of the time as we saw in the above scenarios. Boundary conditions always induce some localized error as we saw, so if the intention of the study or your area of interest is far enough away from the boundary conditions you will get accurate results and make some great design decisions. So don’t be afraid to assume in SOLIDWORKS Simulation.
If you want to watch some content on simulation assumptions check out this video.
For more information, check out our YouTube channel or contact us at Hawk Ridge Systems today. Thanks for reading!