Sensors are useful tools in simulation. They can give you results in the same location across different studies, so you can compare mesh quality, geometry changes, or effects of boundary conditions.
In transient (time-based) studies, you can use sensors to plot the results at a location over time. Sensors are easy to create on an entity like a vertex, edge, face, or body, but they get harder to define and locate in more specific regions that are not selectable.
In this example, I am going to show you how to create a sensor for a node inside a body and plot the results in that location over time in SOLDWORKS Simulation.
Defining the Thermal Simulation
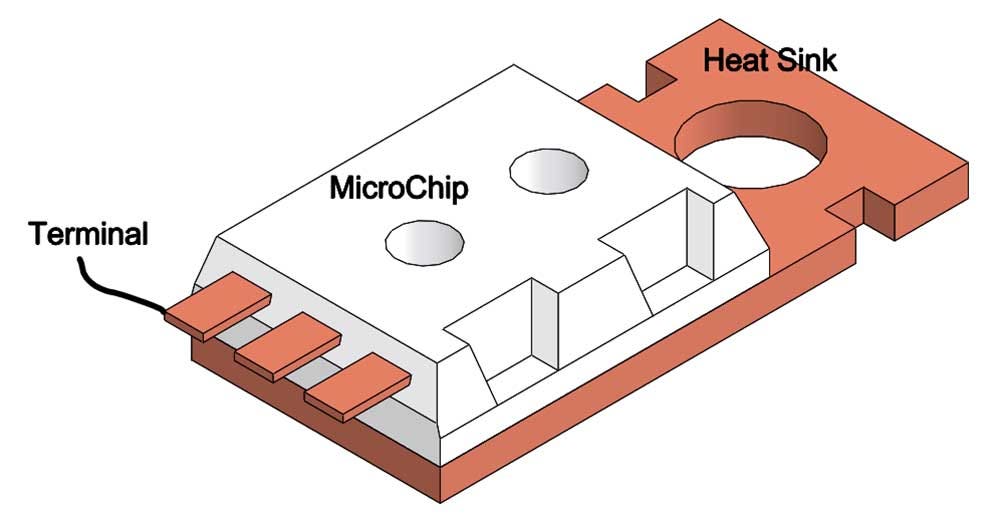
The thermal simulation in SOLIDWORKS will run for 300s, examining the temperature of a microchip that generates heat for 30s then turns off.
The heat generated from the microchip will travel to the heat sink via conduction, and energy will be removed from the system via convection on all external faces of the microchip and heat sink.
The three terminal faces are adiabatic, meaning they will not lose heat to the environment via convection. Below is a labeled screenshot of the components for reference.
Observe the Transient Temperature Results
After running a transient study, a thermal plot can display the results through time, as seen in the gif below. This gif shows the temperature of the assembly through the 300s in 10s time intervals.
We can observe that the maximum temperature changes its location throughout the time span.
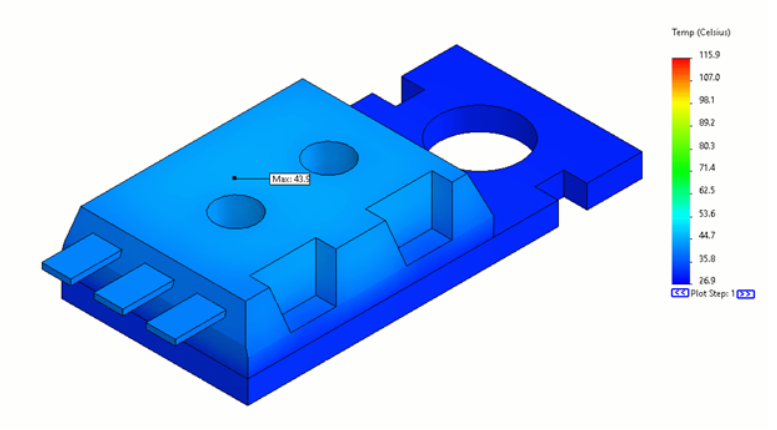
Find the Maximum Temperature Results
In order to find the maximum temperature across the entire simulation, you would need to create a new thermal plot with some different settings. If the plot step is set to maximum, the plot will display the maximum value across all the time steps, as seen below.
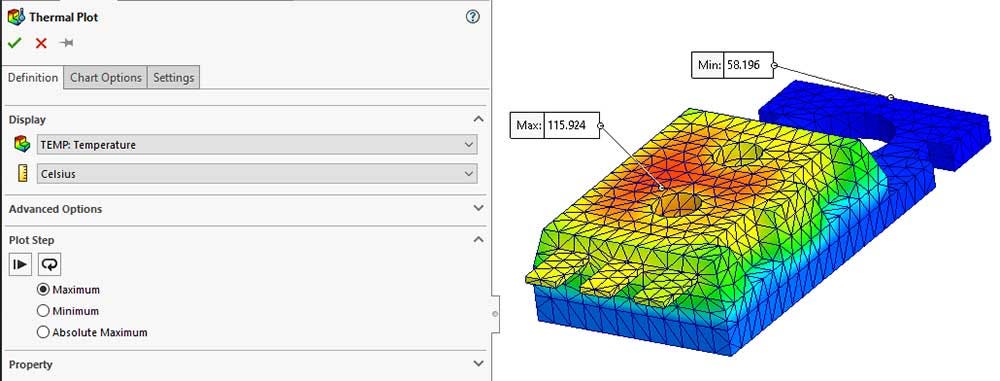
The absolute maximum temperature occurs on the inside of the chip, but at what time step and where exactly? How does that location’s temperature change throughout the simulation?
Creating a Sensor at a Node Location
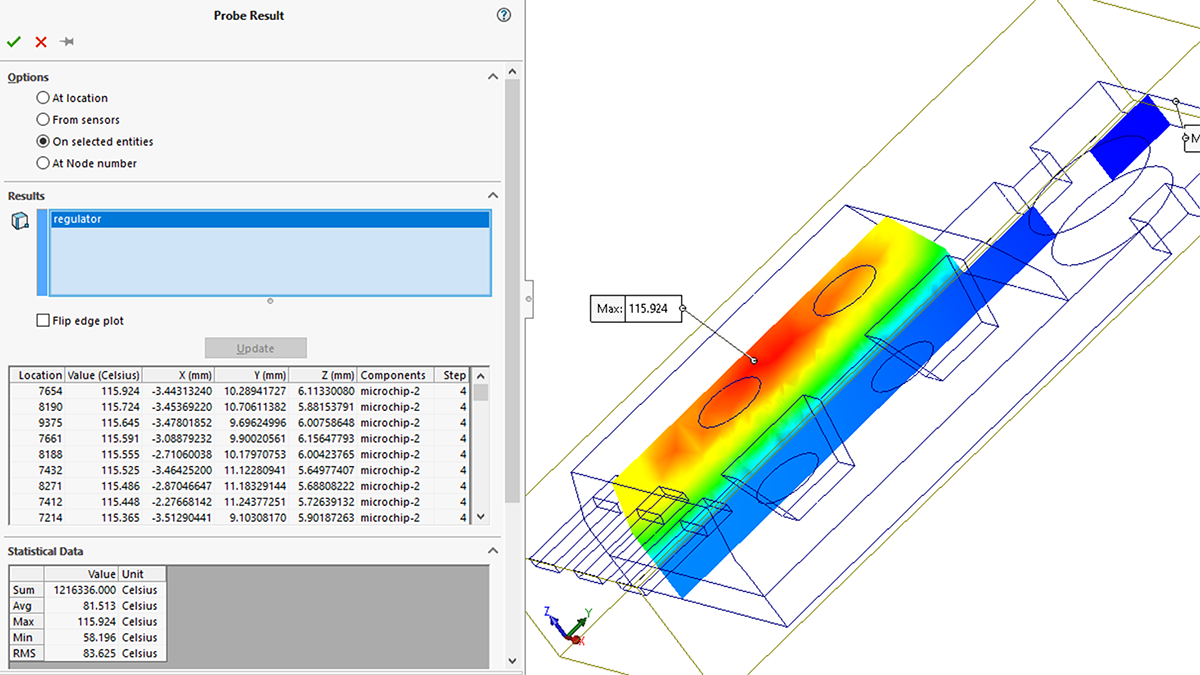
The probe tool can determine the time step, location, and changes in temperature in your simulation. In this example, I ran the probe tool on the entire assembly at the maximum temperature across all time steps thermal plot as seen below.
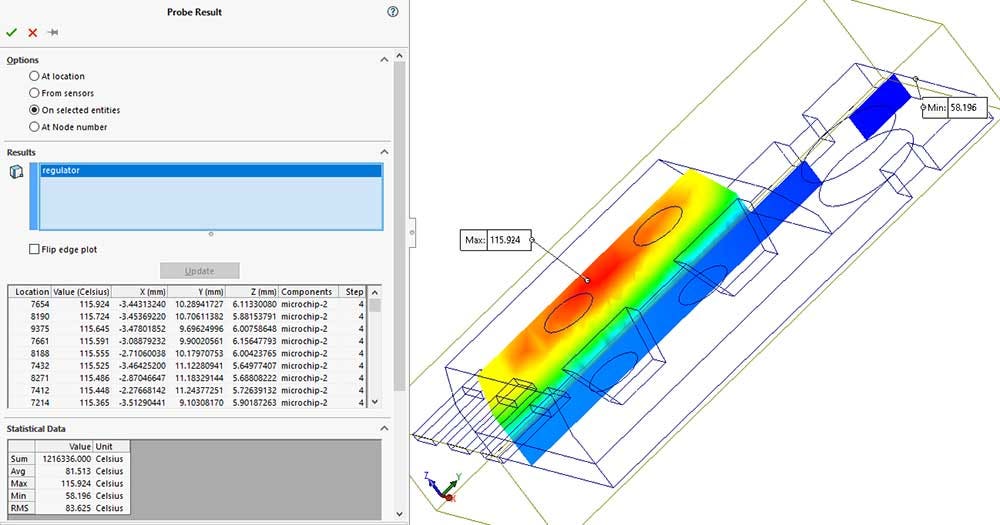
If you filter by temperature, the list will show the node number, Cartesian coordinates of the node with respect to the origin, and the time step of when the maximum temperature occurs.
In this example, node 7654 reaches the simulation’s maximum temperature at time step 4 or 40s into the transient thermal study.
To understand how the temperature at node 7654 changes through the time of the study, you will need to create a transient sensor on that node.
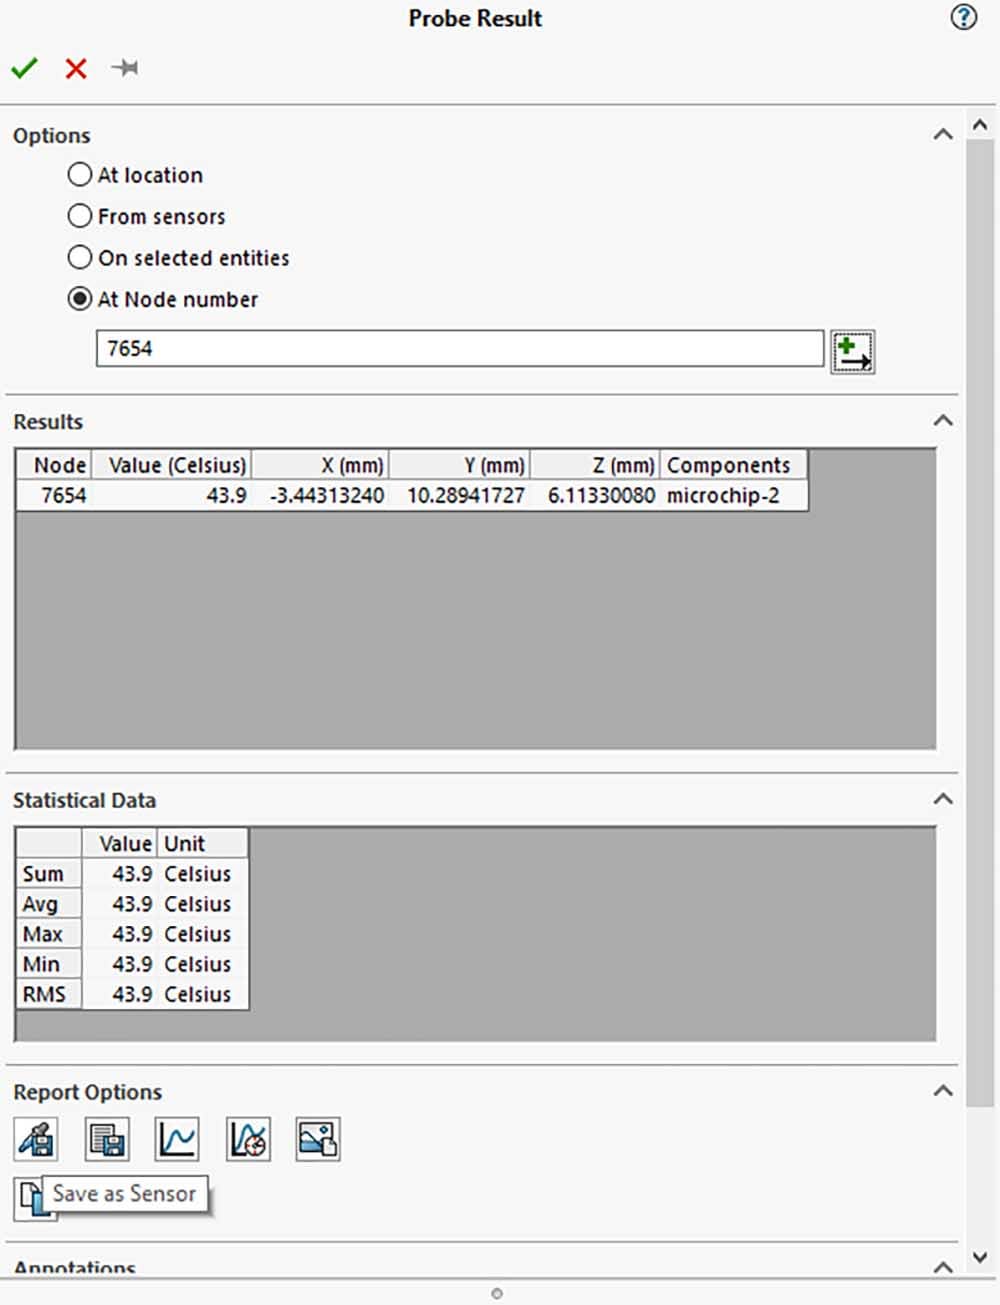
The probe tool can create a workflow-sensitive sensor, as seen in the figure below. The radio button for “At Node Number” is selected, and the node number discovered from the previous step is entered.
At the bottom of the property manager, clicking the first button in the report options will save this node as a workflow-sensitive sensor.
A workflow-sensitive sensor will display the results at the node for whichever plot and time step are active, and that is not entirely what we want.
Editing the workflow-sensitive sensor to be a transient sensor is just a few adjustments to the drop-down boxes, as seen in figure below.
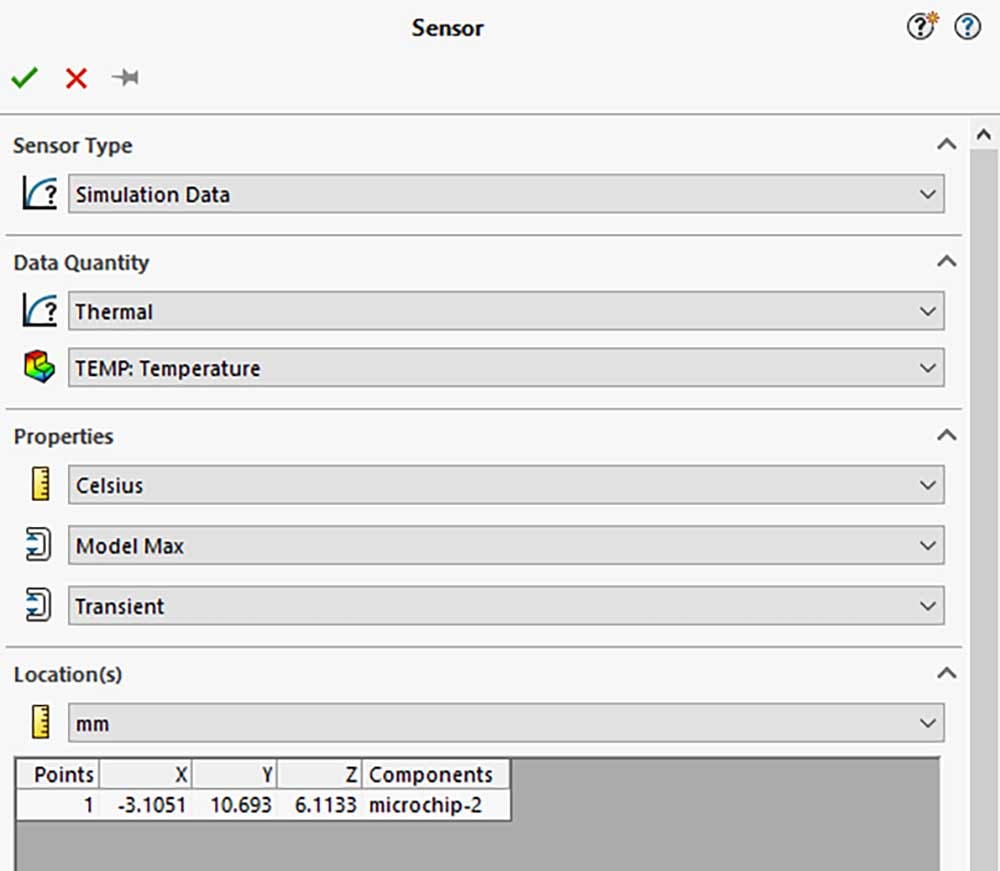
To plot the temperature at the node over time, the Data Quantity should be set to “Thermal” and “Temperature,” and then the sensor properties should be set to “Transient.”
The sensor can now be plotted as a function of time, giving us a transient sensor graph that spikes within the first 70s, then starts to decrease rapidly, and finally, levels out, as seen in the figure below.
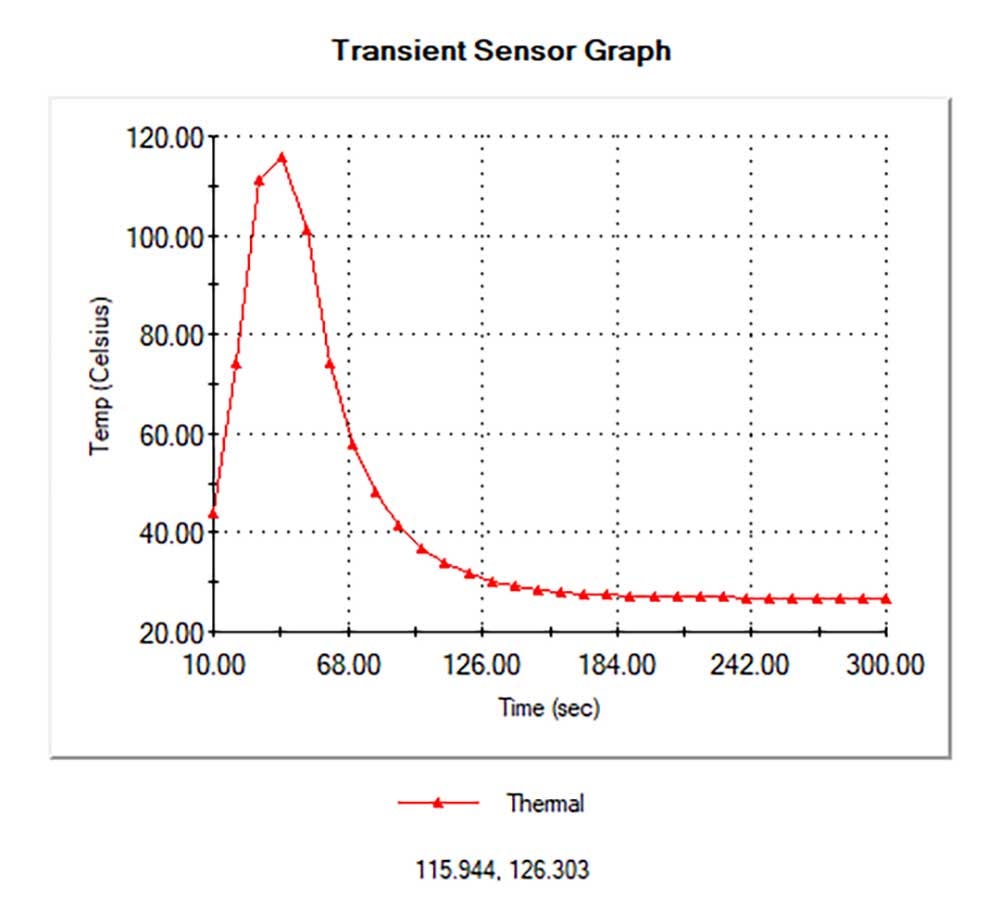
The location heats up when the microchip is on (t=0 to t=30s), then it begins to cool down after the chip turns off (t=30s to t=300s).
Looking at the plot graph, the time of rapidly changing temperature has about seven time steps and is very linear and coarse. It is linear and coarse because the simulation was set to 10s time steps, and most of the action happens in the first 70s.
Refining the Data in the Study
To ensure the maximum temperature was not missed due to the data’s coarseness, you can create a new study with different time parameters.
The new study will run for 60s but have a time step of 1s to refine the data near the maximum temperature. Running the study like this will yield a more refined temperature curve, as seen in the figure below.
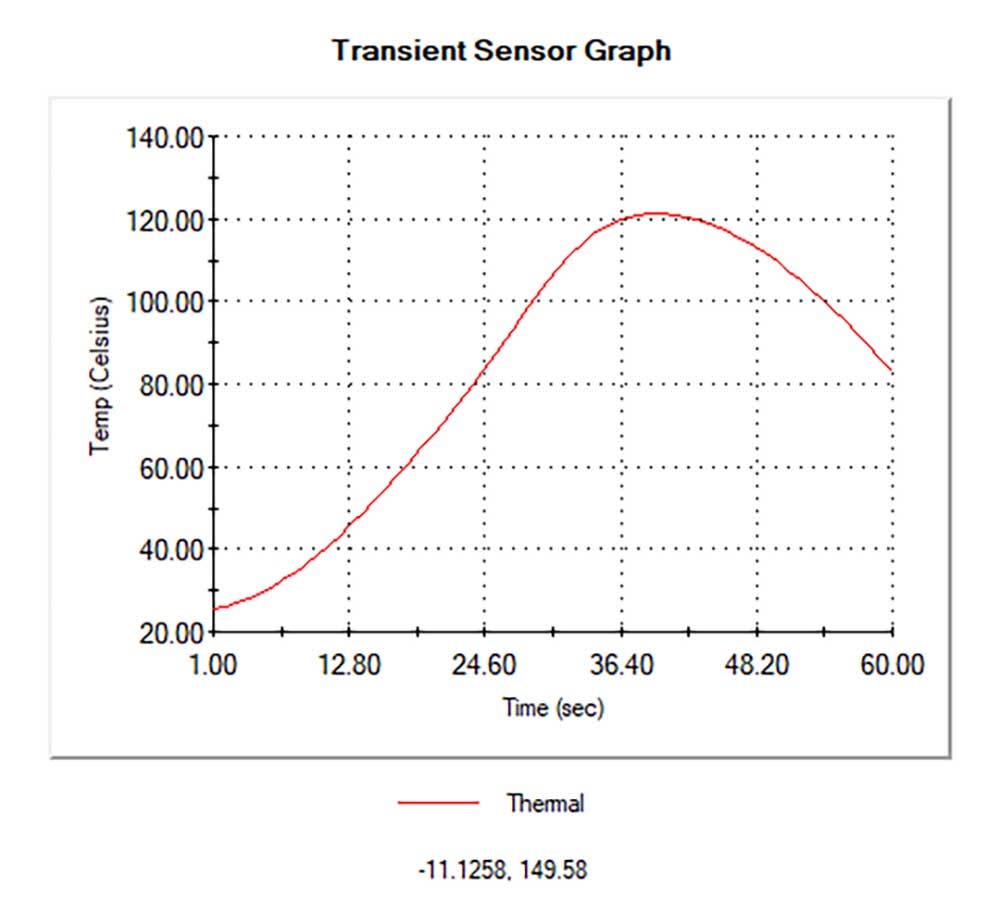
The temperature curve is smooth but peaks at a higher temperature than the coarser analysis, meaning that the initial analysis missed the time when the temperature actually peaked.
The Bottom Line
Transient sensors are great tools for observing the results of a simulation at a specific location over time. They can help you ensure your time steps are refined enough not to miss the true maximums and can help you make smarter and more accurate design decisions.
You can use the probe tool to create sensors in non-selectable locations to get the information you desire quickly and effectively.
If you have any questions, contact us at Hawk Ridge Systems. Thanks for reading!