You’ve seen the commercials and heard the buzz – 5G wireless communication networks are here and promise a future where millions of people and devices share data and interact in real-time.
With so much data flying through the air, designing 5G antennae that get these signals to the right place with minimal interference to or from the surrounding environment is an ever-present challenge. One option for predicting the behavior of these signals is to use an electromagnetics analysis software like SIMULIA CST Studio Suite, which enables users to optimize these elements in a robust simulation environment and ensure the products pass their required physical testing.
While there are solvers in CST Studio to tackle nearly any segment of the electromagnetic spectrum – including AC and DC current in electric motors and generators – the performance and electromagnetic compatibility (EMC) of radio antennae is best analyzed by using the High Frequency category of solvers.

Running a 3D simulation in CST Studio usually begins with importing your geometry and defining the relevant properties from the material library, including electrical conductivity and dielectric constant. For users of SOLIDWORKS, the ability to directly open *.sldprt or *.sldasm files makes this process particularly smooth. After that, communication ports are selected on the geometry to define signal input/output, and the studies are run after selecting the appropriate mesh type and element sizes.
While the high frequency solvers in CST Studio enable the examination of a huge range of results, one feature that simplifies the procedure is the 5G Post-Processing Wizard, which guides you through the post-processing setup for a multi-beam mmWave antenna array as defined by the relevant code.
After running a study, users can select the “5G mmWave CDF+sPD” button from the Post-Processing Tab of the command ribbon. From there, the wizard prompts you to begin by selecting the frequencies you’re interested in observing – for example, 27.5 Ghz, at the upper end of the radio wave spectrum in a band known as “Super High Frequency” (SHF). From there, a text file (*.txt) is imported to specify the properties of each antenna including the module number, amplitude, and phase.
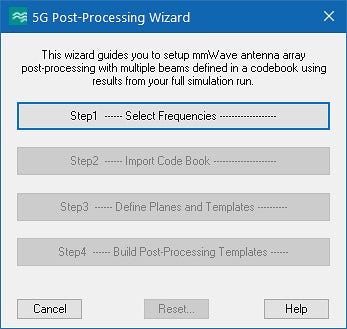
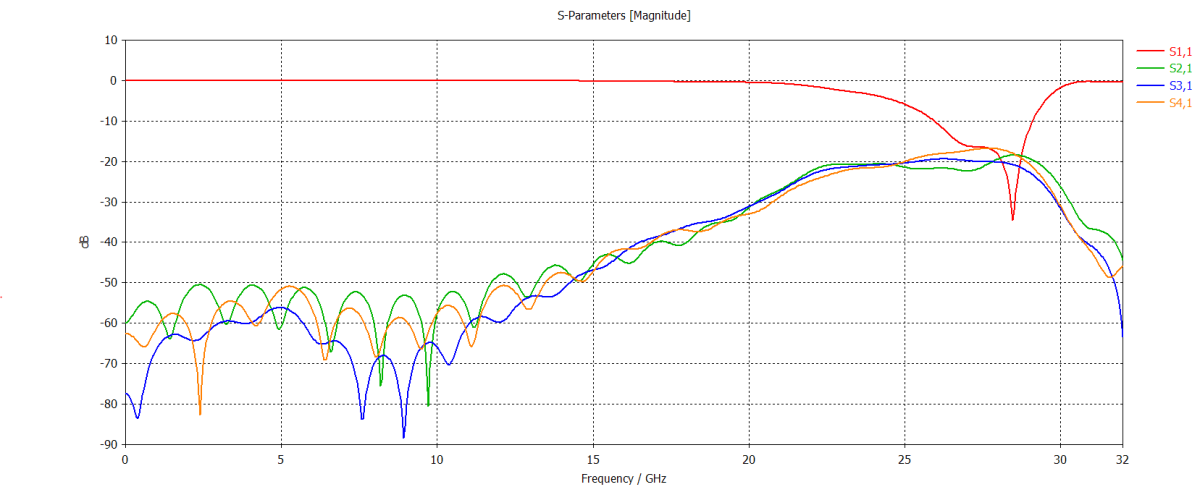
After selecting options such as which signal strength results to include and the X/Y/Z locations of measurement planes, the wizard generates the appropriate result templates including all necessary 1D and 2D result graphs such as S-parameters across desired frequency spectrum.
Here the results confirm that the antennae array has been designed to minimize losses around 27.5 Ghz, the most important communication frequency of this mobile device.
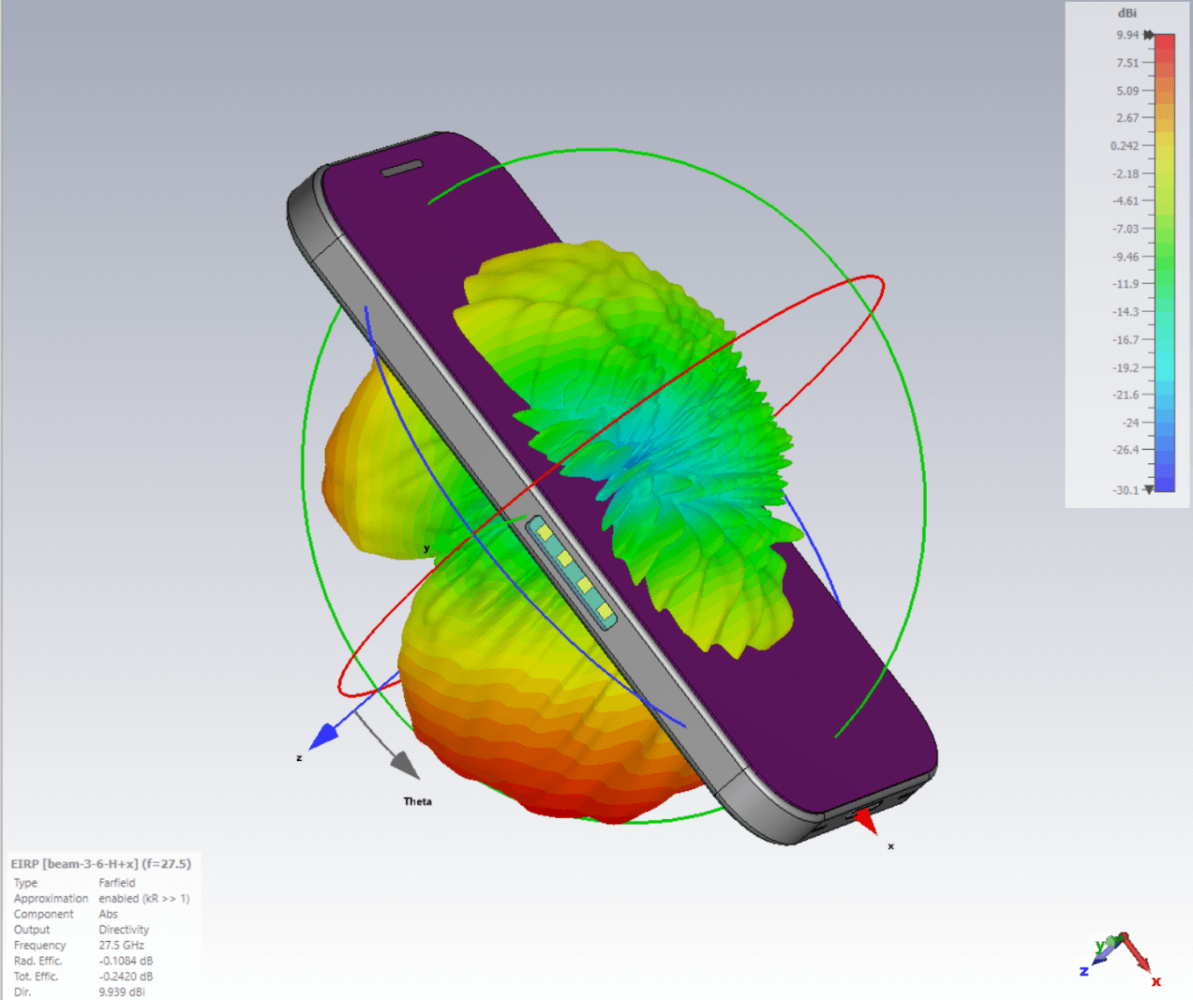
In addition to this, the mmWave results wizard can optionally add templates for Farfield result plots, which are useful for conceptualizing beam pattern and signal strength. Here we’re seeing the Effective Isotropically Radiated Power (EIRP) of a mobile phone in dB, isolated to the previously defined frequency of 27.5 Ghz.
Watch Webinar Now
Check out our recent webinar recording for a more detailed look into how the analysis results from CST Studio were used to improve the signal strength of the 5G antennae array from this mobile device.
For more information on how SOLIDWORKS and SIMULIA tools can fit your application, don’t hesitate to contact us at Hawk Ridge Systems today. Thanks for reading!
