Thanks for stopping by! The goal of this article is to give you an overview of time-based motion analysis. Motion analysis is a powerful tool that’s available if you have SOLIDWORKS Premium or Simulation Standard, Professional and Premium. Motion can simulate moving or dynamic systems and will give outputs to size your design. Some of the outputs are:
- Displacements
- Reaction Forces
- Accelerations
- Motor Power
If you don’t know the timing of events in your study, then you need event-based motion. We have a video on our YouTube channel about setting this type of study up here.
Before we get started, there are some important assumptions that you need to make. First, all of the bodies need to be rigid. Second, in order for the results to be accurate, you must have density assigned to all the components in the analysis. Third, the motion will take the mates in your assembly into account, so make sure those are set up correctly.
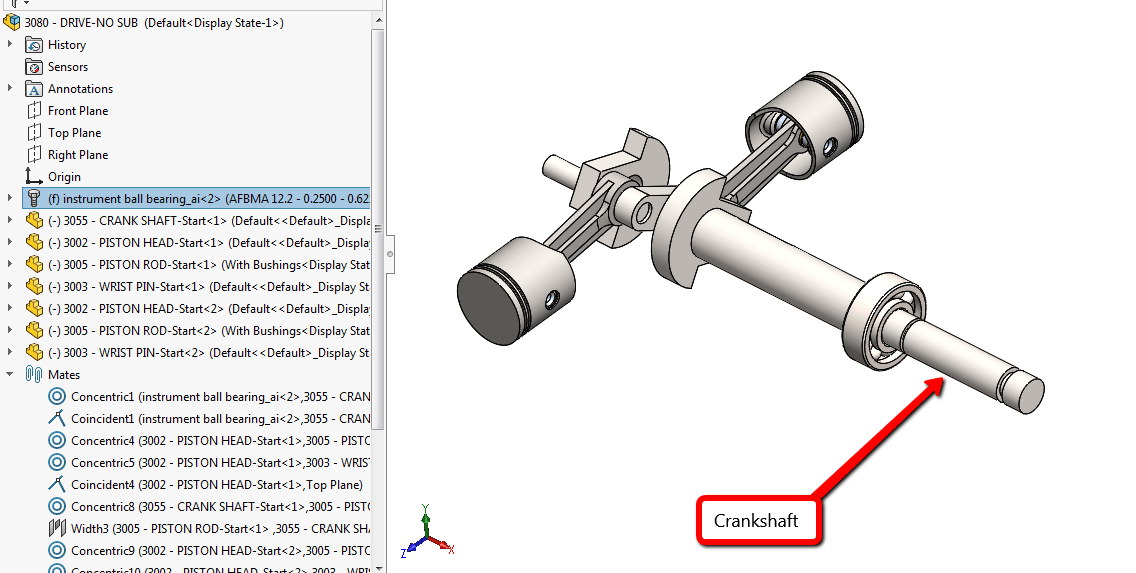
Let’s take a look at this drive assembly that I’m using in my RC car. I have all of the parts I need and I’ve put in mates. I can rotate the crankshaft to test the motion by moving it. I need to know the RPM on my motor to make sure the pistons have the correct velocity while the crankshaft is spinning. I’ll guess at the RPM value to see what velocity I get at the ends of the pistons. I’ll use a motion analysis for this.
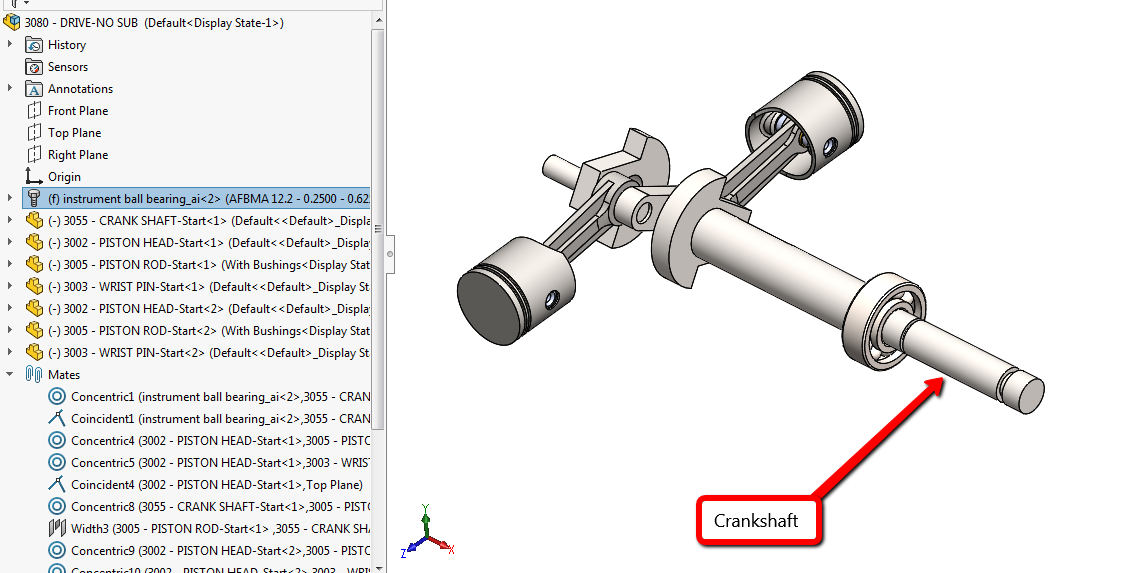 The RC car’s drive assembly has all its mates in place, ready for a new motion study to check crankshaft RPM. The RC car’s drive assembly has all its mates in place, ready for a new motion study to check crankshaft RPM. |
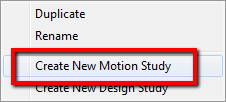
At the bottom of the graphics area is a default Motion Study 1 that is in every part and assembly. You can use that, but I’ll create a new one by right clicking and selecting Create New Motion Study.
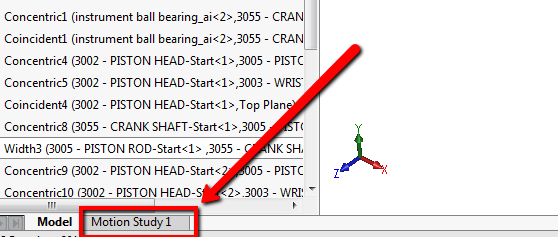 Right-clicking the Motion Study tab lets you create a new study instead of using the default one. Right-clicking the Motion Study tab lets you create a new study instead of using the default one. |
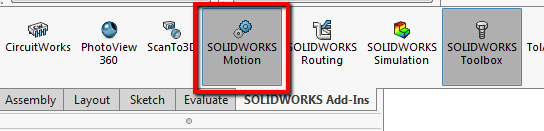
 SOLIDWORKS Motion must be enabled in the Add-ins list before Motion Analysis functions become available. SOLIDWORKS Motion must be enabled in the Add-ins list before Motion Analysis functions become available. |
Make sure SOLIDWORKS Motion is turned on in your Add-ins.
 |
To start my analysis, I’m going to switch to Motion Analysis by selecting it in the pulldown that says Animation. You can see all of my parts and mates are available in my study.
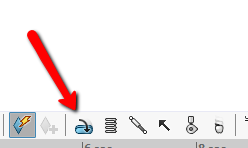
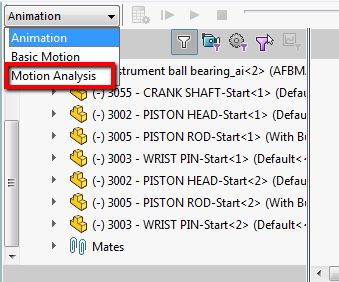 Switching the pulldown to Motion Analysis brings up a toolbar of motors, springs, dampers, and gravity. Switching the pulldown to Motion Analysis brings up a toolbar of motors, springs, dampers, and gravity. |
Looking at this toolbar on the top, these are the different ways to make the assembly move. These simulate real world conditions. There are motors, springs, dampers, gravity, etc.
 |
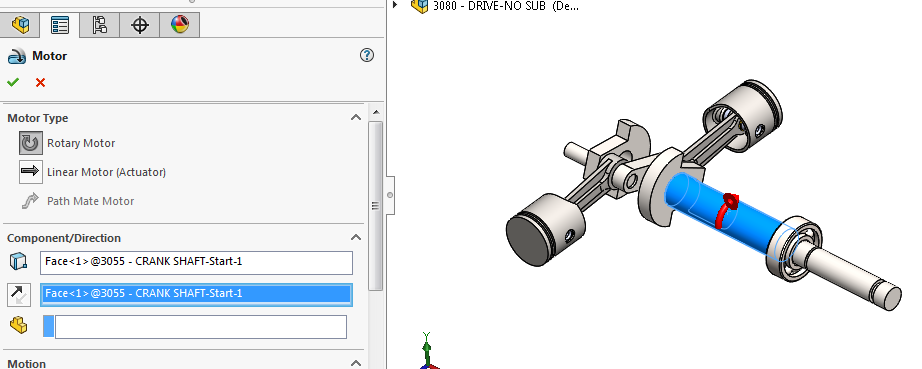
I’ll use a motor, which can be defined in complex ways. Rotary will match my motor, and I’ll pick a face to apply it to and the same face will also define the direction. You can see the red arrow which way the assembly will rotate, and I can reverse that if I’d like.
 A rotary motor is applied to a face, with a red arrow showing rotation direction that can be reversed if needed. A rotary motor is applied to a face, with a red arrow showing rotation direction that can be reversed if needed. |
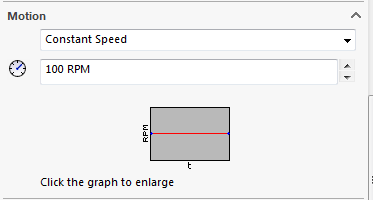
 Motion type options include constant speed, distance, and oscillating, with Constant Speed at 100 RPM a good start. Motion type options include constant speed, distance, and oscillating, with Constant Speed at 100 RPM a good start. |
There are different ways we can define the motion, such as constant speed, distance, or oscillating. Pick the one that matches the actual motor. I’ll use Constant Speed and 100 RPM is a good start. It’s easy to go back and edit the speed later.
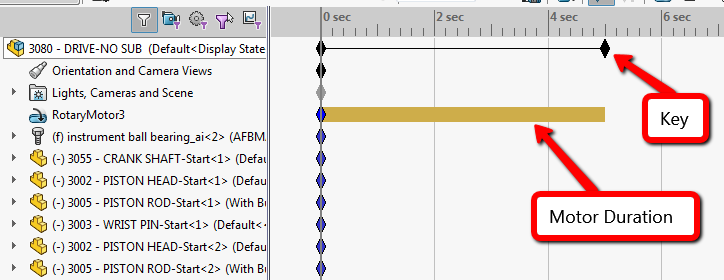
 The study defaults to a 5-second duration, adjustable by dragging the black key, with room to add gravity. The study defaults to a 5-second duration, adjustable by dragging the black key, with room to add gravity. |
Notice the software puts a default length of time of 5 seconds for the overall study time. I can lengthen or shorten it by dragging the black diamond or key. You can also put in other actuators if you’d like, or gravity, but I’ll keep mine simple. The brown bar corresponds to the length of time that the actuator is applied, and can be adjusted.
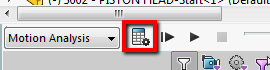
 Clicking Calculate runs the motion study once the study length and actuators have been set. Clicking Calculate runs the motion study once the study length and actuators have been set. |
To run the study, click Calculate and the study runs.
 |

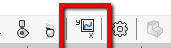
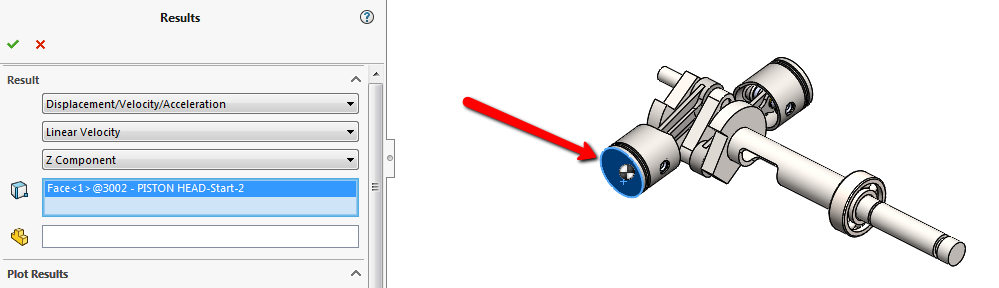
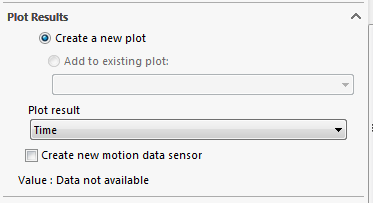
Now it’s time to get the data I want out of this study. To get a plot, click on the Results. I can define the plot using different parameters, and I’ll define a Linear Velocity plot in the Z direction. Since I’m interested in the face of the piston, I’ll select that and plot that result against time.
 |
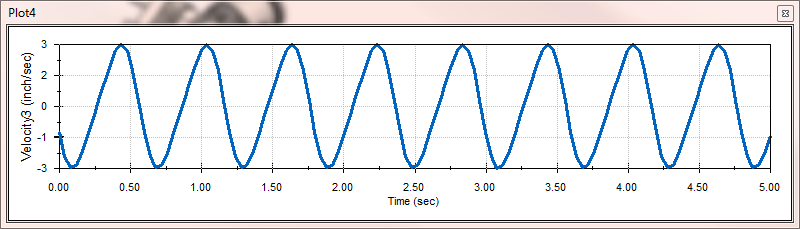
 The results plot shows the assembly reaching a peak velocity of 3 inches per second, useful for sizing the motor. The results plot shows the assembly reaching a peak velocity of 3 inches per second, useful for sizing the motor. |
 Peak velocity data from the motion study helps determine whether the chosen motor is appropriately sized. Peak velocity data from the motion study helps determine whether the chosen motor is appropriately sized. |
The results plot shows that the velocity reaches 3 inches per second at its fastest. I can make a decision about the size of the motor based on that.
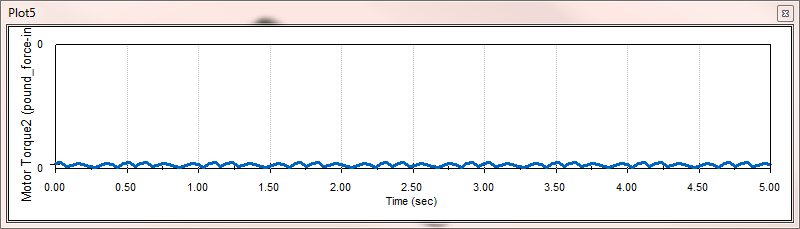
 A second plot tracks motor torque, showing a low value that confirms the motor isn’t being overloaded. A second plot tracks motor torque, showing a low value that confirms the motor isn’t being overloaded. |
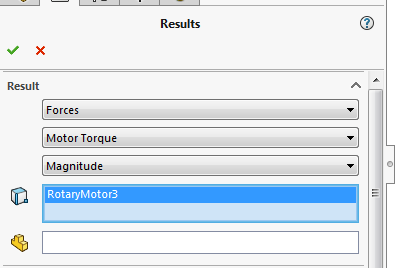
A second plot that might be useful is the amount of torque put out by the motor. I’ll define the second plot and select the motor. This shows that the torque is pretty low, showing that I’m not overloading the motor. To make this number more realistic, I can add friction and resisting forces, thus driving up the torque value.
 Adding friction and resisting forces to the motion study would make the torque results more realistic. Adding friction and resisting forces to the motion study would make the torque results more realistic. |
 Motion study results like these can be exported directly into a static simulation study for further analysis. Motion study results like these can be exported directly into a static simulation study for further analysis. |
Also, these results can be exported to a simulation study, like a static analysis.
In this blog, I went over setting up a time-based Motion Analysis. For more information, check out our YouTube channel or contact us at Hawk Ridge Systems today. I really hoped you enjoyed this, and thanks for reading!