SolidWorks Simulation - Automatic Plot Digitizer

SolidWorks Simulation – Automatic Plot Digitizer

Table of Contents


When running different types of analysis, I frequently find myself entering blocks of data to define curves of various types. Whether it be a fan curve or a pressure drop curve for a filter, in SolidWorks Flow Simulation, a stress-strain curve for SolidWorks Simulation, or a Power Spectrum Density curve in a random vibration study in SolidWorks Simulation Premium, this can often be a tedious task.

Typically my process is to print out the curve, manually trace off some data points using a ruler and a pencil, then enter that data into SolidWorks or Excel to be used.

But that was before I stumbled across a neat little free utility on the web written by Joseph A. Huwaldt – http://plotdigitizer.sourceforge.net/

It takes that manual task and makes it digital and automatic (and easy). Here’s what I can do now.

  • Take a screenshot of the plot I want to use, in this case a fan curve from a cooling fan manufacturer (and the new snipping tool in Windows 7 makes this fantastically easy):
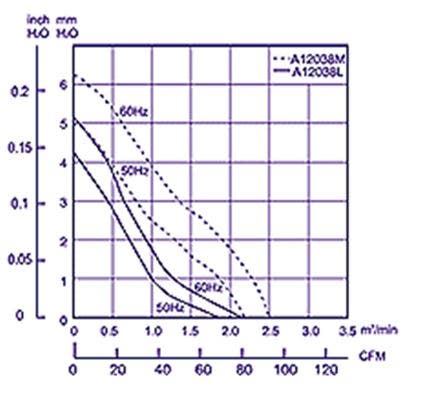
  • Launch the digitizer and import the picture. It works with any common picture format.
  • Pick two points on the x and y axes to calibrate the digitizer, and tell the software the value of those.
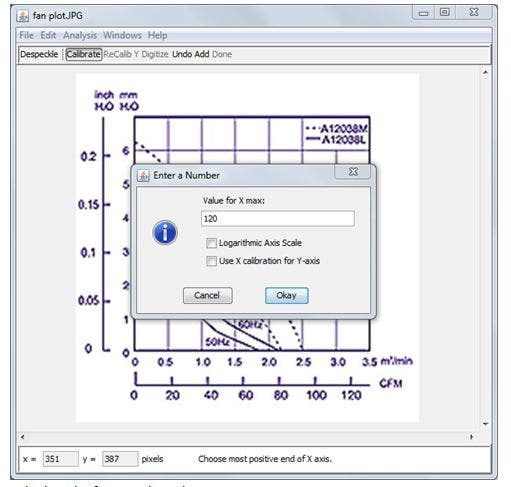
  • Pick a bunch of points along the curve.
  • Hit done, and you’ve got your data set, ready to be copied into SolidWorks or Excel.
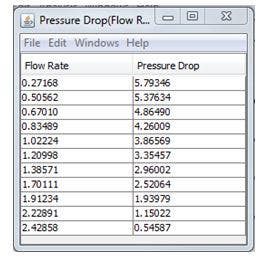
I can now load curves into SolidWorks in a matter of seconds, rather than minutes, which helps to make my day that much smoother. Credit goes to the Simulation Product team at SolidWorks who pointed this little gem out to me.

Glenn Whyte

Glenn Whyte

Glenn Whyte is the Director of Technical Sales at Hawk Ridge Systems. He is involved in the implementation and support of SolidWorks Simulation tools for mechanical, thermal, and fluid flow analysis, serving HRS customers up and down the West Coast.
0 0 votes
Article Rating
Subscribe
Notify of
guest

3 Comments
Oldest
Newest Most Voted
Inline Feedbacks
View all comments
BZ
BZ
2 years ago

This is tons more productive when transferring printed material properties into non-linear runs!

Matthias
Matthias
2 years ago

Hi,
I just installed Plot Digitizer on my PC and the testing worked quite well. Know I have two problems.

The first one is a methodical problem with the digitization of my scanned plots. I want do digitize plots with a curved y-axis which are used for thermo-hygrographs or barometers (Looks like this one: http://thumbs4.picclick.com/d/l400/pict/171625588135_/Lambrecht-Hygrograph-Thermograph-Messgerate-Trommelschreiber-Messblatt-5-St-ck.jpg). Is it somehow possible to modify the y-axis so it fits to the analog axis? Has anyone heard about that problem before and knows a solution?

Second one is about the integration of autotrace. I downloaded the program and put it in the same folder like Plot Digitizer. Then I changed the search path as follows (as described on http://plotdigitizer.sourceforge.net/):
Windows Start -> Control Panel -> Advanced System Properties -> Environment Variables -> User Variables -> changing the PATH-Variable to “Q:\PlotDigitizer_2.6.6_Windows\autotrace-0.31.1-w32\autotrace.exe”.
But I just don’t know how to use it. How can I start autotrace and the automatic digitization? There are no additional buttons or something. Maybe quite a stupid question but I don’t know how to go on!

I would bee very happy if anyone could help me

Best regards

Matthias

Glenn Whyte
Glenn Whyte
2 years ago

Hi Matthias,

I’m not aware of the inner workings of the plot digitizer tool, it was just a cool piece of software we found on the web and wanted to share.

You might want to post your question over at the forum linked to the download page – http://sourceforge.net/p/plotdigitizer/discussion/ or attempt to contact the author of the software through there.

Otherwise, someone might see your comment on this blog and have a suggestion for you.