Managing contacts is something that comes up constantly when working on
customer projects in
SOLIDWORKS Simulation. I recently had a project that involved a large and complex assembly with
numerous contacts to be defined. There were three things I was concerned about
when trying to plan, setup, and review contacts in the analysis:
- Where contact will have to be defined manually between faces and components
- What type of contact is used and which faces/components were selected
-
To make sure that a no penetration contact was defined between the correct
components
There were three tools and plots in SOLIDWORKS and SOLIDWORKS Simulation that
I used to visualize and check the contacts in my analysis: Interference
Detection, Contact Visualization Plot, and Contact Pressure Plots. Let’s take
a brief look at how each of these work.
Interference Detection
In SOLIDWORKS Simulation, the global component contact will automatically
apply the specified contact condition to all faces that are initially
touching. To help see which faces will be used, there is a tool within
SOLIDWORKS
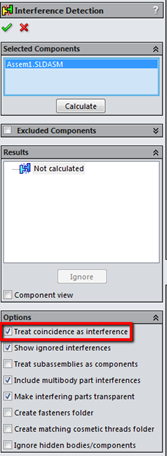
called Interference Detection. To use it, start by going to
Tools > Interference Detection. This is
where you can enable the option to “Treat coincidence as interference”.
Under the results section, there will be a list of all the initially touching
faces. Clicking on a result will highlight the touching faces in red as in the
screenshot below. Don’t forget to enable the options to “Show ignored interferences”
and “Include multibody part interferences”.
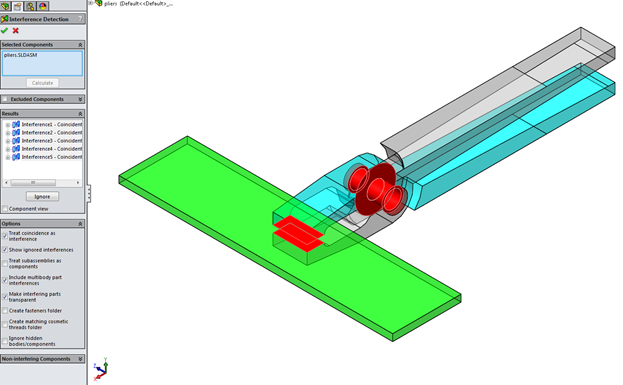
The Interference Detection Results Show Coincident Faces Highlighted in
Red
Bonus Tip: This tool is also one of the
four tools I use before running my analysis. As the name suggest, interference between components can be found by not
enabling the “Treat coincidence as interference” option. Removing
interferences will help prevent problems when trying to mesh and solve an
analysis.
Contact Visualization Plot
Starting with SOLIDWORKS Simulation 2014, visualization plots can be created
to help visualize the type of contact and the faces/components that are used.
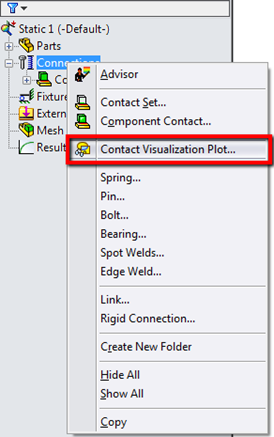
To create a contact visualization plot, right-click the
Connections folder in the Simulation tree and choose “Contact Visualization Plot”.
After clicking Calculate, the results section will show all
the contacts that have been defined along with, whether it is a global contact
or contact set and the type of contact. Selecting an item in the results will
use a particular color, based on the type of contact that is defined, to
highlight the face in the graphics area. Below is a table of the types of
contact and associated colors that are used:
| Contact Type | Color Rendering |
|
Bonded |
Red |
|
No Penetration |
Purple |
|
Allow Penetration (Free Contact) |
Green |
|
Shrink Fit |
Orange |
|
Virtual Wall |
Yellow |
|
Thermal Contact Resistance |
Purple |
|
Insulated |
Green |
Contact Visualization Results Highlight Contacting Faces Based On Type
Contact Pressure Plots
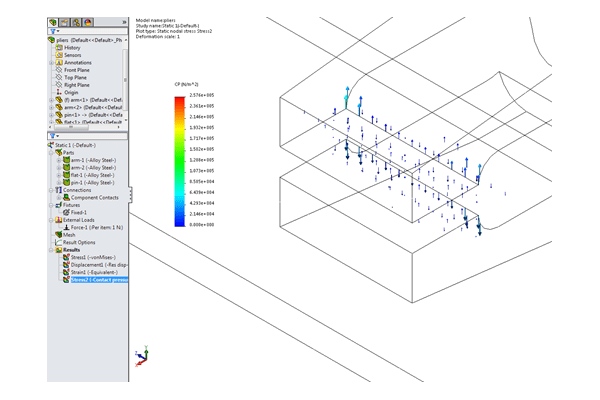
In SOLIDWORKS Simulation, a useful plot to help see if there is a no
penetration contact defined between components is a contact pressure plot.
Contact pressure is the result of two bodies coming into contact during an
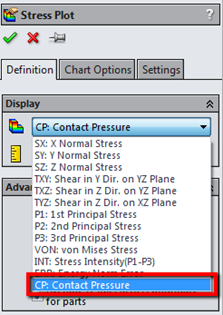
analysis with a no penetration contact defined between them. To create a
contact pressure plot, define a Stress Plot by right-clicking
the Results folder from the Simulation tree.
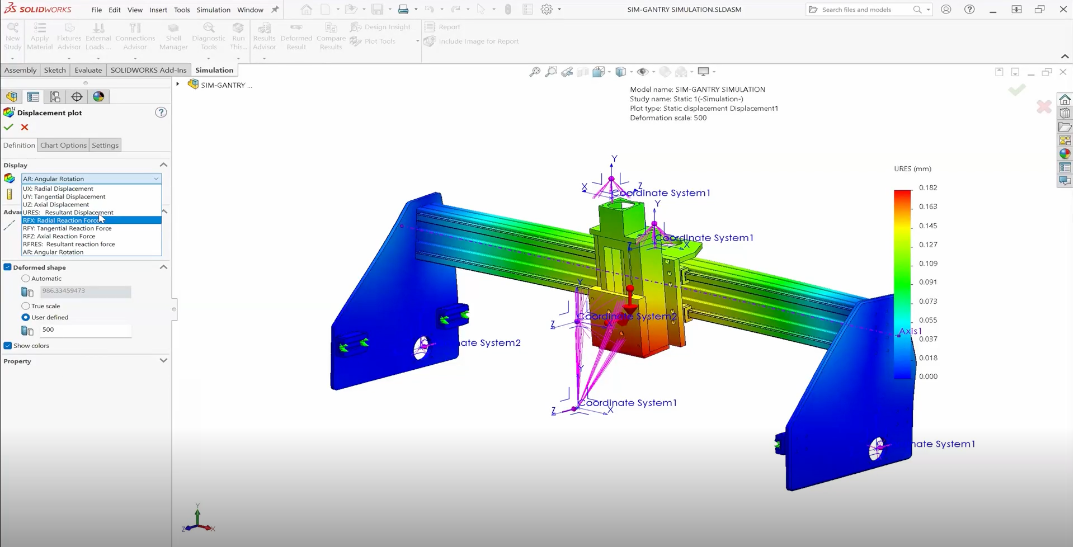
The plot that is generated can either be a vector plot that shows contact
pressure between all components or a color plot that shows contact pressure
between selected components. Starting with SOLIDWORKS Simulation 2014, contact
pressure plots can also be created in a 2D simplification analysis.
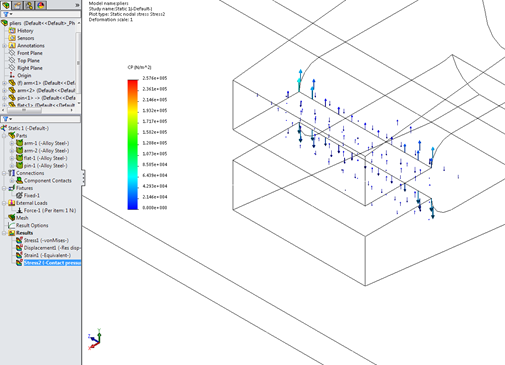
Contact Pressure Result Shown As A Vector Plot Between Faces With No
Penetration Contact
Hopefully these tools can help you setup contacts more quickly and
efficiently. To learn more about these features and tools, I encourage you to
look at the SOLIDWORKS and SOLIDWORKS Simulation Help. Also, if you have your
own tips and tricks for handling contact in an analysis, please share them in
the comments section below.