If you were to hook my brain up to a projector and start scanning for things I
remembered from engineering school, stress-strain curves would probably pop
up. Once upon a time I (probably) recreated one or two of these curves in a
materials lab, but nowadays I settle for giving the every-man definition: a
stress-strain curve is a collection of data describing how resistant a
material is to stretching. Naturally, if you’re looking to run a stress
analysis on your products in
SOLIDWORKS, there’s a good chance you know this information may be important too. If
you aren’t exactly sure why or how, read on. The first thing to determine
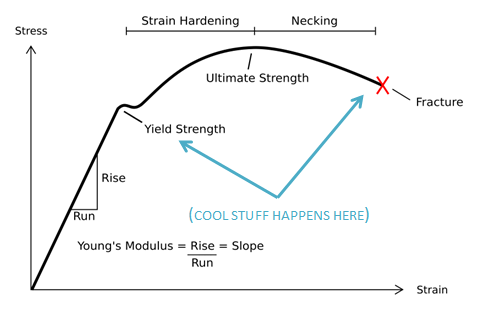
about stress-strain curves is when you actually need to use them. If you’ve
ever seen one, you know that it’s usually a line graph with stress on the
y-axis and strain on the x- (typically from a uniaxial tensile load). You
likely know that for ductile materials like metals, there is a relatively
straight, steep section at the beginning followed by a sudden bend and then a
section with more curvature. This bend is known as the yield point, at which
the material begins to deform permanently (and
generally do interesting things).
In most cases, yielding is rather undesirable, so engineers are trying to make
sure the maximum stress in a product doesn’t get close to the yield strength.
If that’s true for you, the full stress-strain curve isn’t needed; a
quick-running
Linear Static
stress analysis in SOLIDWORKS ignores the post-yield behavior and only
requires you to enter the Young’s Modulus, a simple number that describes the
straight, elastic region of the curve. But if you’re looking to see the real
behavior of the material even after yield (like a sagging beam or your iPhone
being dented on the ground), you’ll need to run a study that allows a
Plasticity material model, such as
Nonlinear Static
or
Drop Test. Assuming you’ve chosen an appropriate study type, the option will be
available under the Model Type drop-down in the Material Library. There are
multiple Plasticity models, but the most common one is the von Mises model,
which assumes yielding occurs when the
von Mises equivalent stress (published in 1913 by a
suave young Austrian) exceeds the yield strength.
The stress-strain curve can now be defined on the Tables & Curves tab
under the “Type” drop-down menu. In this case, the curve is already visible
because I’ve picked one of the default SOLIDWORKS materials that include the
data it, noted by the “(SS)” annotation at the end.
If you want to use a material that isn’t in the library or doesn’t have the
stress-strain curve, you’ll need to create a custom material and fill in this
table (default SOLIDWORKS materials cannot be modified).
Pro-tip: additional stress-strain curves are available in the file
“cosmosworks curves.cwcur” under [SOLIDWORKS Installation
directory]SOLIDWORKSSimulationCWLangEnglish. Access these by
right-clicking the name of your study and selecting Define Function
Curves.
It’s important to be careful when entering the data as two common mistakes can
occur if you aren’t paying attention (which absolutely never happens to me,
ever). First, make sure the units match your material data before you fill in
the table. Strain is always entered as a decimal (i.e. 1% strain is 0.01), and
in this example, stress has been set to N/mm^2 or megapascals. If you change
the stress unit after entering the data, SOLIDWORKS will convert the
values for you, making them very wrong very quickly. The cells can be filled
in by clicking in the table and typing, or by pasting (Ctrl+V) copied data
from an external spreadsheet program such as Microsoft Excel. HTML tables,
text files or other documents may work as well. The second common mistake is
not putting the correct range of values in the table. If you’ve obtained
stress-strain data from a material vendor or text, it probably starts at a
strain of 0, indicating no load applied from the test fixture. In SOLIDWORKS
however, only the post-yield information needs to be entered because the
pre-yield region of the curve is assumed to be perfectly linear and perfectly
elastic (or, a straight line with the slope of the Young’s Modulus). So, the
first cell in the table should always be at the yield stress of the material
(this is why the preview of the curve may look different than your source).
Ideally the last entry for the stress-strain curve will be the fracture point
of the material (when it literally broke), so remember that any areas of your
model showing strain above this value would in reality be cracking and coming
apart. Finally, one more adjustment may be necessary depending on how the
strain information of your material was provided. By default, SOLIDWORKS
Simulation uses the more-common
engineering strain, which is simply calculated as the change in length of some material divided
by its original length:
By contrast,
true strain
(some would call it perfectionist strain) is calculated as the natural log of
a material’s final length divided by its original length:
If your stress-strain data was supplied using this more precise true strain
calculation, you’ll need to go to the Properties menu (right-click on the name
of the study in the analysis tree) and select the “Large strain” option. The
option is aptly named- using a curve defined with true strain will be more
accurate at extreme deformations where the cross-sectional area of the
material begins to shrink from stretching.
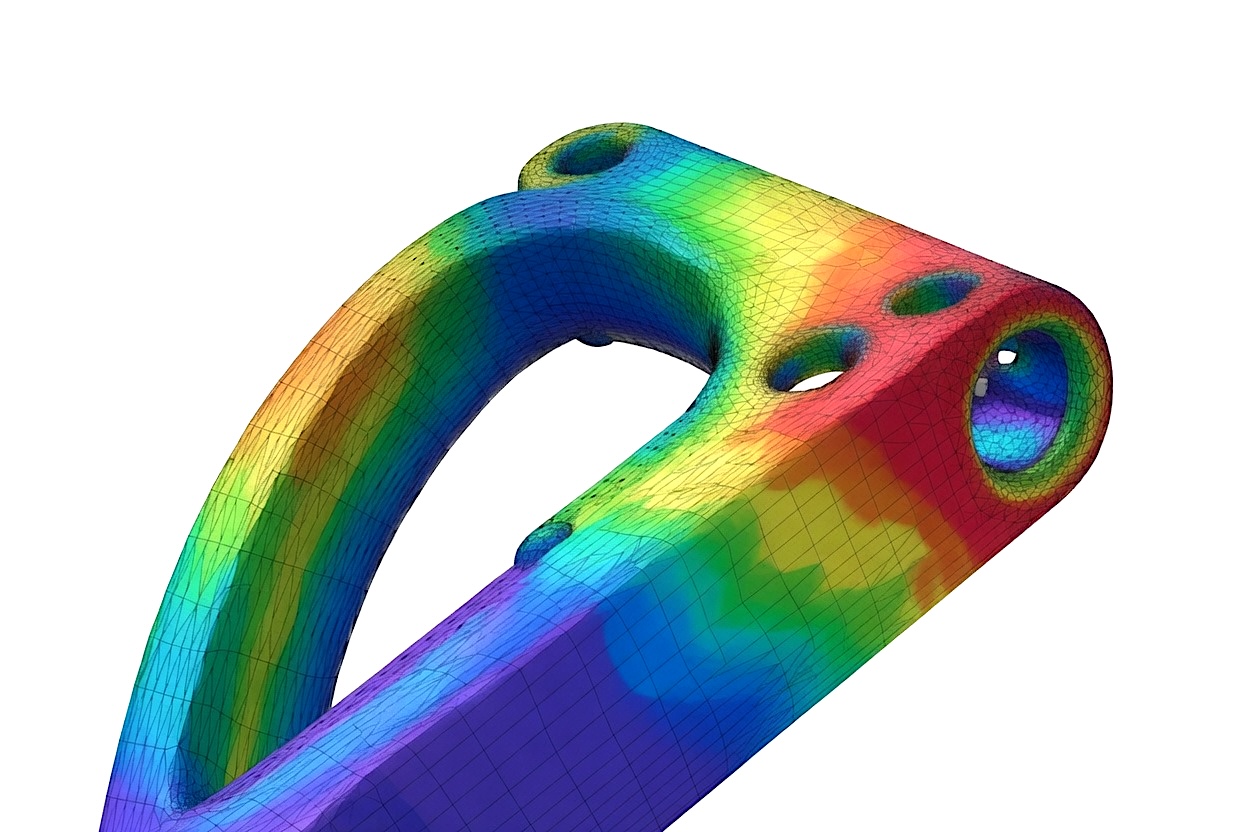
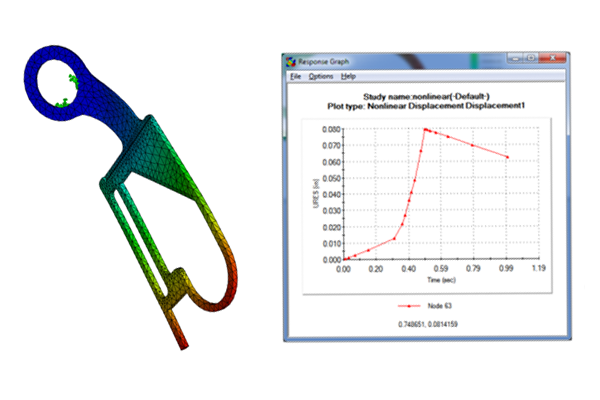
Assuming you’ve checked these steps off your list, upon running the study you
should be warmly greeted by results showing realistic stress, displacement,
and strain of your design even after yielding. In fact, by using the Probe
tool on a displacement plot and clicking the Response button, it’s often easy
to see the yielding in the material occurring as the load is applied followed
by the permanent deformation when the load is removed.
Stay tuned to the HRS blog for more journeys through time, space, and getting
computers to do our work for us.