DeflateGate 2015: Tom Brady’s Case in SOLIDWORKS Flow Simulation

DeflateGate 2015: Tom Brady’s Case in SOLIDWORKS Flow Simulation

Table of Contents

Whether you’re a fan of the
National Football League
or not, by now word has spread to even the most dedicated SOLIDWORKS
drafter of the scandal over last week’s AFC Championship game, in which
the New England Patriots
allegedly violated NFL rules by intentionally under-inflating their
footballs
. How much this benefited quarterback Tom Brady is still up for debate,
but the more important question surrounding the game arose last Friday
when Coach Bill Belichick stated that the team’s own investigation
found Mother Nature was to blame
for the recorded drop of 2 psi measured at halftime. A plethora of voices
from academia have weighed in, with many agreeing that taking the
team-supplied footballs from the warm environment of the locker room to
the chilly field of Foxborough- er, that is, Gillette Stadium, would have
caused a corresponding drop in pressure.

SOLIDWORKS Flow Simulation

Professor Richard P. Binzel at MIT, for example,
used the ideal gas law
to estimate that “a 5 to 10 percent dip in temperature could bring about a
drop of 0.5 to 1.5 pounds per square inch, or psi, in a ball’s air pressure.”

We in the world of simulation are aware of both the power and the limitations
of hand calculations. In this case, it does appear that the ideal gas law
predicts at least some of the reported pressure drop, but using this equation
makes one big assumption: that the temperature of the air inside the ball
actually would cool down to the same temperature as the air on the
field. Luckily, a heat transfer problem like this is just the of type thing
SOLIDWORKS Flow Simulation, our embedded
computational fluid dynamics
tool, is designed to tackle.

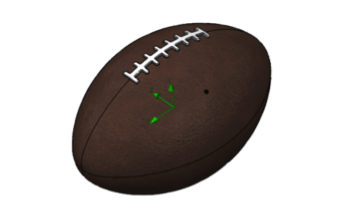
To start with, we need a 3D model of a football, which luckily I know how to
create in
SOLIDWORKS:

SOLIDWORKS Flow Simulation

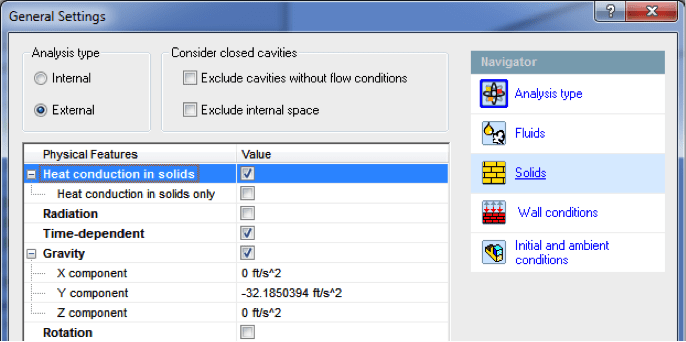
Going through the setup wizard of our first project, we need to make sure to
enable the key physical conditions that make for an accurate simulation.
First, I selected an External analysis and enabled Gravity so we can simulate
the natural air currents around the outside of the ball. Heat conduction in
solids needs to be turned on so we can simulate the pigskin cooling down once
on the field, thereby cooling the air inside. Also, Time-dependent has been
selected since I need to know how quickly these temperature changes would
happen to see if the story adds up.

SOLIDWORKS Flow Simulation

On the Fluids tab, I selected the pre-defined model for air; no further work
required. Under Solids, we’d need to choose the material for the ball, which
nowadays is constructed of a synthetic leather with a bladder lining the
inside. Those materials don’t exist in the default engineering database, so I
created a custom material with a thermal conductivity of 0.2 W/m-K, similar to
both rubber and leather which have good insulation.

Finally, it’s important to select the proper initial and ambient conditions.
The game time field conditions in Foxborough were reportedly 51 degrees
Fahrenheit, with an atmospheric pressure of 14.64 psi (slightly below normal).
We also have the option in Flow Simulation to set a wind speed, but here I
left it at zero. Even though there would have been some wind, and the ball
would have been flying through the air a good part of the time (cooling it
even faster), I also ignored the heat that might have been added to the ball
from players or referees holding it.

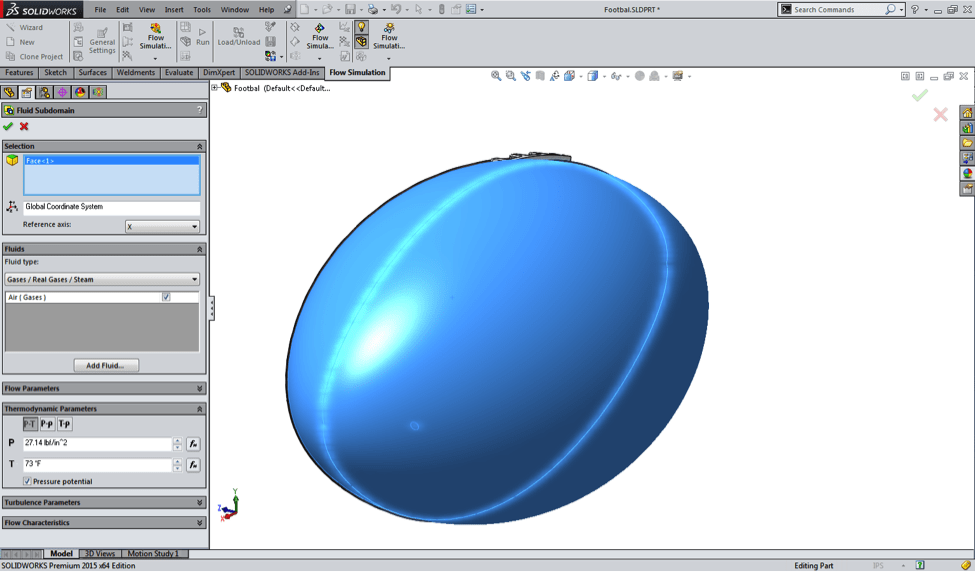
At this point, the only remaining task was to enter the initial conditions of
the air inside the ball, by creating what’s called a Fluid Subdomain.
If the ball was really inflated to the league-minimum 12.5 psi inside the warm
locker room (I guessed 73˚ F), the air inside the ball should still have those
same conditions the minute it’s brought out onto the cold field, barring any
leaks (intentional or otherwise). Note here that I’ve typed in 27.14 psi in
the pressure box, but don’t worry- I haven’t pulled a
Jim Marshall. Flow Simulation always uses absolute pressure in its setup and results, so
a “gauge” pressure of 12.5 psi really means 12.5 psi above atmospheric. In
other words, the absolute pressure is 14.64 + 12.5 = 27.14 psi.

SOLIDWORKS Flow Simulation

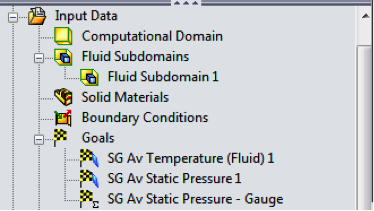
Before running the analysis, I made sure to set up some Goals in my project,
which allow me to quickly see the key results. In this case I selected the
average temperature and average static pressure on the inside faces of the
ball, plus created my own custom Equation goal which will report gauge
pressure, just the same as any of the NFL referees would have seen.

SOLIDWORKS Flow Simulation

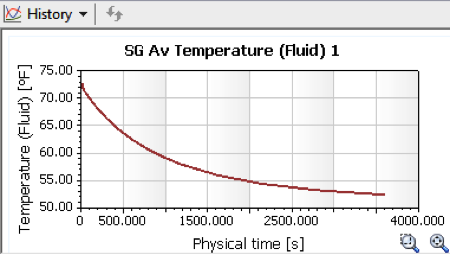
So what are the results? Assuming a time out on the field of 60 minutes, or
3600 seconds, the cold New England conditions would in fact cool the ball down
a lot, to about 52.5 degrees, but not quite as cold as others have assumed.

SOLIDWORKS Flow Simulation

SOLIDWORKS Flow Simulation

SOLIDWORKS Flow Simulation

So what effect did this drop in temperature have on the ball pressure?

SOLIDWORKS Flow Simulation

SOLIDWORKS Flow Simulation

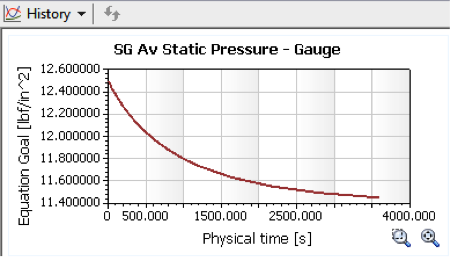
SOLIDWORKS Flow Simulation reports a final pressure of 11.45 psi, equal to a
drop of 1.05 psi. So, this is a partial explanation, but it
doesn’t fully account for the drop of two “pounds” reported by the
officials at halftime. But wait! There’s more!

This is where Coach Bill Belichick comes back into the discussion. During his
now infamous press conference, Belichick claimed that in addition to the
on-field cooling, the
balls could have been affected by the team’s normal “conditioning”
process
, where they try and break in the leather to create a more pleasing grip for
Brady.

SOLIDWORKS Flow Simulation

“So that process of creating a tackiness, a texture, a feel — whatever the
feel is, it’s just a sensation for the quarterback, what’s the right feel,
that process elevates the PSI approximately 1 pound.”

Bill Nye the Science Guy, Seahawks fan and hero of nerdy 90’s kids, weighed
in, saying Belichick’s explanation “made no sense.” But what if Belichick was right, and it is in fact
possible that rubbing the footballs heated up the air inside to above even the
locker room temperature, leading to an ever bigger temperature (and thus
pressure) drop out on the field?

Once again, hand calculations are of no use here, but we can have Flow
Simulation find us the answer. This time I had to make some larger
assumptions: namely, that the balls would be “conditioned,” i.e. rubbed for
something like 5 minutes, or until the outside surface of the ball was roughly
the temperature of someone’s hands. A bit of research informed me that in a
73˚ F room,
the average temperature of a person’s hands is 86˚ F
(not quite your internal body temperature of 98.6 ˚). To simulate the friction
of the conditioning, I decided to apply a heat generation rate of 10 Watts to
the outside of the ball (by comparison, the average human body at rest
generates about 70 W of heat).

While it pains me to say so, after plotting the results I was forced to
conclude that in this instance, Bill Nye was not, in fact, the Science Guy.

SOLIDWORKS Flow SimulationSOLIDWORKS Flow Simulation

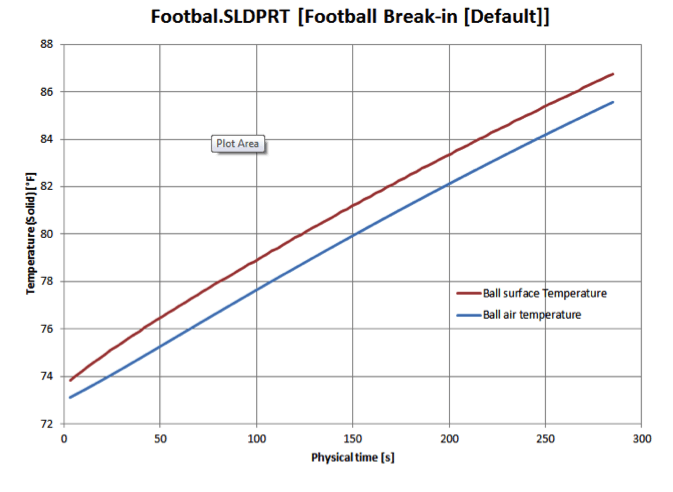
If the outside of the football were warmed in such a manner, the air
temperature inside wouldn’t lag far behind, reaching a maximum of about 85
degrees after about 4 ½ minutes. The corresponding increase in pressure turns
out to be real, the balls would measure just under 13.1 psi at this point.

SOLIDWORKS Flow Simulation

Of course, what Belichick and others have claimed is that the pressure in the
Patriots’ footballs was set after the balls were warmed. So, the
question becomes, what would the footballs have measured at halftime if they
were in fact filled to 12.5 psi when the air inside the ball was 85˚ F, rather
than the assumed locker room temperature of 73˚? I plugged in the new number
and re-ran my first simulation to find out.

SOLIDWORKS Flow Simulation

SOLIDWORKS Flow Simulation

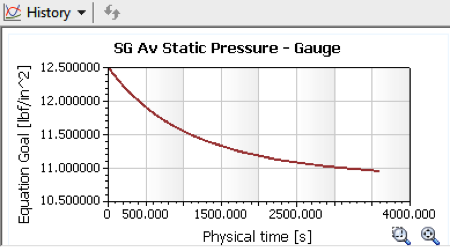
Behold, after 60 minutes of exposure, the air inside would still have cooled
down significantly, albeit about 3 degrees above ambient. Still, the
now-larger temperature change of 31˚ results in a corresponding drop in
pressure to 10.95 psi, aka “under-inflated” by 1.55 psi. We don’t know
what the official measurements of each ball were, but if I wasn’t a technical
guy I could see myself rounding this off and telling a reporter “two pounds.”
We could also question many of our assumptions, was the ball actually out on
the field longer? Did the air temperature drop below 51˚ F during the game?
Doing so is as simple as changing the setup conditions, or even the 3D model,
and hitting Run.

So, what am I saying, are the Patriots the good guys after all? No, you can
argue that they knew what they were doing, gaming the system to create cushy,
under-inflated balls for Mr. Brady. What I can say is that Bill
Belichick’s explanation is plausible: normal temperature changes prior to and
during the game could have caused the balls to drop by almost 2 psi without
somebody actually letting any air out.

The only thing left to do is put Flow Simulation to its traditional use,
simulating engineering problems to improve the quality of products. Now I just
have to figure out what the current defect with the San Francisco 49ers is,
and give them a call…

Damon Tordini

Damon Tordini

Damon Tordini is the Product Manager for Plastics and Flow Simulation out of Hawk Ridge Systems’ Costa Mesa, California office. Damon received the SOLIDWORKS Elite Applications Engineer award in 2012 and is a two-time presenter at SOLIDWORKS World. When he's not waiting for his last simulation to finish, you can probably find him making some kind of noise, which he claims is music.
0 0 votes
Article Rating
Subscribe
Notify of
guest

36 Comments
Oldest
Newest Most Voted
Inline Feedbacks
View all comments
AB
AB
2 years ago

Awesome article. Just an FYI, the temperature did drop below 51F during the game, it was around 40 at halftime.

patsfan
patsfan
2 years ago

Hey, very nice article. I was wondering, what your reasoning for using 10 Watts to simulate rubbing the ball?

patsfan
patsfan
2 years ago

Thanks!

Doug
Doug
2 years ago

The conditioning process actually involves brushes to scuff the footballs. A lot of the time it’s actually a power tool like a grinder or a polishing with a brush attachment. This video from 2006 with Brett Favre shows the process. http://espn.go.com/video/clip?id=12221498

Greg
Greg
2 years ago

I love the techie stuff 🙂
BTW, the media backed off the 2 psi reports and later reported it was closer to 1 then 2. Matches the simulations almost exactly.

Misterspokes
Misterspokes
2 years ago

One thing I noticed is you did not account for the rain in your calculations, this could also change the rate at which the ball’s temperature/pressure change as well

Andrew Jordan
Andrew Jordan
2 years ago

Good stuff, thank you for putting in the time and effort. Also disagree about gaming the system by taking clever advantage of rules without breaking them. You can do that and still be a good guy 🙂

Kelp Monkey
Kelp Monkey
2 years ago

This is a superb piece of work!

ILikeFootball
ILikeFootball
2 years ago

Hi Damon,

This is very interesting, thanks so much for the effort! Just one quick thing: I believe when the footballs are “conditioned,” they are actually done so with machines that can get very hot, so it seems that could help make up for the difference there, as well.

I should also mention that reference to such a difference assumes that all of the footballs were, in fact, 2PSI below. One report our now has suggested that one of the footballs was 2 under, while the other ten were closer to 1. In that case, it’s possible that the climate change alone could have accounted for the difference. We are still dealing with many “facts” here that seem to be changing on a daily basis.

Ray
Ray
2 years ago

What about the fact that it was raining?

I did not see (I apologize if I missed it) where you accounted for the fact that the balls were wet.

I noticed the Carnegie Mellon experiment said that that also had an effect on the pressure.

P. Dangle
P. Dangle
2 years ago

Nicely done. My only exception, “You can argue that they knew what they were doing, gaming the system to create cushy, under-inflated balls for Mr. Brady”, sorry, this doesn’t matter – at ALL. Either the balls were at 12.5 PSI when the referees inspected them, or not. That’s it. PERIOD. Them’s the rules. You can’t argue it both ways.

PS. I won’t ask you to do a flow simulation of the bathroom break by that scurrilous surreptitious scalawag of a ball boy. 🙂

JK
JK
2 years ago

Here is the headsmart labs video (started by Carnegie Mellon engineers)

HeadSmart Labs “DeflateGate” Study: http://youtu.be/CxsXFX3tDpg

Andrew
Andrew
2 years ago

Very interesting piece.

As we know, Chris Mortensen (@mortreport) tweeted on January 20 that “NFL has found that 11 of the Patriots footballs used in Sunday’s AFC title game were under-inflated by 2 lbs each, per league sources.”

While the NFL rulebook says that the ball should be inflated between 12.5 and 13.5 PSI, the manufacturer’s website states: “Pounds of air pressure in an NFL game ball: 13 psi.” This suggests that the actual spec for the ball is likely 13.0 +/-0.5 PSI. (See: http://www.wilson.com/en-us/football/nfl/wilson-and-the-nfl/trivia/)

Presumably, the league will be able to show the readings from the Patriots’ footballs at halftime and the public will know whether “under-inflated by 2 lbs each” is relative to the lower bound of 12.5 or the manufacturer spec. Absent more detail, we simply do not know.

Given that your results show that the ball would be at 10.95 PSI, your work could explain the entire difference as your number is 2.05 PSI below the manufacturer spec. Of course, a drop in temperature below the 51 degrees you’ve assumed (which would presumably be knowable from weather station records) or more rigorous rubbing by Patriots’ staff could account for more of a drop as you note in your piece.

Finally, it seems to me that your process could also be used to help explain another mystery in the case: why the Colts’ footballs tested fine before the game and remained fine at halftime. Many pundits are suggesting that they did not change, which deepens the mystery (and increases the perception of malfeasance by New England). Of course, this would bend the laws of physics.

The simplest answer could be that the Colts’ balls were at the 13.5 end of the range during the pregame test and dropped ~ 1 PSI by halftime and therefore still read within range (or, if your calculation held for their balls too, 12.45 PSI which would likely be read as 12.5 PSI on an analog gauge). But absent any facts on where their balls started out, this is simply conjecture on my part.

Have you looked into running a similar calculation for their balls, potentially assuming different starting pressure levels? What would it take for their balls to start and end in-range? Putting myself in the officials’ shoes, seems safe to assume that they might test the Patriots’ balls first upon their return to the locker room to determine if there was a problem. Only then would they likely have tested the Colts’ balls as well. How much would an extra few minutes in a 70 degree environment increase the PSI of the Colts’ balls? What if the referees reinflated the Patriots balls before turning to testing the Colts’ balls? Would waiting an additional 5-10 minutes make a difference? What would we expect to see in each of these scenarios if their balls started at 13.0 PSI before the game? What about at 13.5?

There are a ton of questions and a ton of variables here, but I’m hoping your methodology may be able to shed some light on them.

All in all, a fascinating issue to explore. I look forward to your thoughts!

JeffreyLXV
JeffreyLXV
2 years ago

Great read. Another factor is leather becomes more pliable when wet. A football’s outer layer can stretch, allowing the strong urethane bladder inside to expand. Same amount of air but less pressure. The footballs are manufactured to expand and constrict. The Wilson Company test them to 100 psi. Evaporation has also been mentioned as an additional cooling factor, especially on the wet and windy night of the AFC championship game.

Ray
Ray
2 years ago

Good stuff

Thanks for doing it! I realize your goal was not to exonerate, but to objectively look at the facts without trying to force a predetermined outcome.

Here was the video I referred to. I think the point was that the wet leather would also expand, not so much a temperature difference, which of course as you correctly point out it would cool the football down even further.

https://www.youtube.com/watch?v=CxsXFX3tDpg

And where you accounted for the rubbing process in your experiment but skipped the water, they included the water and skipped the rub down.

Never thought I would put this much thought into a football being 1-2 PSI under inflated (initial reports of 2 psi have been said now to be closer to 1, but who really knows).

Olimpio DeMarco
Olimpio DeMarco
2 years ago

Thank you Damon for doing this flow simulation. Your assumptions seem reasonable, and your conclusion feels right!

Will you be at SOLIDWORKS World in Phoenix?

Go Patriots!!!

i_j_m
i_j_m
2 years ago

Hi Damon —

Fascinating work. I know there are some remaining questions surrounding the football preparation process that could increase temperature, and I found something that might help. Back in 2006, ESPN had a special where they went through the football breaking in process for Brett Favre: http://espn.go.com/video/clip?id=12221498 – since this was reposted on January 24th, I have to think the Patriots might have a friend at ESPN.

Starting at about the 13 second mark on this video, you get some fairly clear footage of the kinds of power tools being used and, notably, how this process can be done as recently as within 15 minutes prior to giving the balls over to the officials. Judging by what is being done to those balls, your estimates might actually be very conservative.

Thanks!

Theo
Theo
2 years ago

I like all of the situational tests. But one thing I see missing in almost every one (including the HeadSmart Labs deflategate study), is the actual game balls were all taken all the way back in and re-measured inside the officials locker room deep inside Gillette stadium where they were originally checked (and adjusted up to minimum if necessary) for proper inflation. It takes time in the warmth to get back there again, and some balls exposed to the warm air while others being tested ans documented. How much psi was regained in that re-warming up process? (yet they still measured under, and the Colts footballs were within specification?) That would mean psi on the field would have to be even less than folks are simulating in their tests, yes?

kevin
kevin
2 years ago

So, the balls probably dropped around 1.5 – 2.0 psi? So we need to be looking at the Colts. That means they were the real cheaters. #inflategate

I did here somewhere the measurements were taken at halftime and the end of the game. That means the temp drop wouldn’t matter. Or would it?

Andrew
Andrew
2 years ago

Damon: Given your assumptions on indoor and field temperature, would the pressure curve for an unrubbed ball initially inflated at 13 psi look the same as your first SG Av Static Pressure – Gauge scenario, just starting and ending 0.5 psi higher?

Also, would the pressure curve as the ball warms (given the same conditions) be the same curve turned on its head, with some pressure returning quickly as it is reintroduced into the indoor environment, but taking about an hour to return to the original PSI?

Back of the envelope, it appears that the ball list approximately 0.45 psi of the total 1.05 psi drop in the first 500 seconds (8:20) and roughly another 0.25 psi in the next 500 seconds. Would the cool ball experience a similar increase in pressure in these timeframes when brought indoors?

Taken together – and again, using rough numbers to approximate your curve – this might suggest that:

(1) a ball initially inflated to 13.0 psi would have dropped to approximately 11.95 psi in the first half. One returned to 73 degrees, pressure might increase by 0.45 psi to 12.4 psi in the first 8:20 and then by another 0.25 psi to 12.65 psi by 16:40. Since halftime is 15 minutes, the ball would likely be around 12.5 psi after 10-12 minutes indoors – which would be registering as legal.

(2) a ball initially inflated to 13.5 psi would have dropped to approximately 12.45 psi in the first half. One returned to 73 degrees, pressure might increase by 0.45 psi to 12.9 psi in the first 8:20 – back in the 12.5-13.5 range.

I’ve certainly made a number of assumptions here, but does this back-of-the envelope calculation hold water? Seems it could present a viable scenario re: why the Colts’ balls tested in-range at the half while the Patriots’ balls tested well below.

Sean
Sean
2 years ago

Check out the big brains on Damon!

I’m glad to see some actual science instead of just pontificating about what may have happened.

Sam
Sam
2 years ago

How do you account for heat loss to the atmosphere from the ball surface, and the insulating/conducting affect of the leather and rubber layers of the ball? Wouldn’t both of these variables have lead to inefficient transfer of heat to the interior of the ball? Wouldn’t this have made it difficult for the heat of the skin to reach the same temperature as the hand?

I’ve always thought the biggest hole in Belickick’s explanation wasn’t the weather’s ability to reduce the pressure, but rather heating the interior of the ball from preparation enough that the pressure drop would occur on the field, and you’ve shown that theoretically it is possible. The best case scenario for this being weather related would be if the prep heated the air in the ball, and then the pressure was reduced, producing an internal temperature of 85-90*F, and a pressure of 12.5 PSI. They couldn’t add air because that would reduce the temperature. The next variable though to consider is also the amount of time after prep was concluded until the official checked the ball. If too much time passed, the ball would loose temperature to the outside environment and pressure would decrease. It would then not pass.

Do you have an estimate as to how much time could pass between the conclusion of the preparation to when the officials checked it? In actuality, it is likely some time greater than what you show in your first graph in which temperature decreases by 10*F within 10 s. I doubt a ref is standing by waiting for this process (i.e. power tools, etc.) to take place for each ball before he checks it. Granted, the temperature of the ball would be decreasing in room temperature and not field temperature, but I doubt the time to equilibrate with ambient temperature would be much longer.

Andrew
Andrew
2 years ago

Thanks, Damon. Figured that there were other variables involved.

That said, your analysis and my back-of-the-envelope calculations (assuming they are directionally correct and still hold once the real curves are applied) would explain:

(1) How both the Patriots’ footballs and the Colts’ footballs would have tested in the acceptable 12.5-13.5 range pre-game.
(2) How the Patriots’ balls would have fallen well below the range during the first half (10.95 psi according to your calculations and assumptions about the weather, which may have been conservative). Note that this is 1.5 psi below the lower limit and more than 2.0 psi below the target pressure – which could explain the Mortensen report.
and
(3) How the Colts’ footballs tested in the acceptable range at the half (assuming they started at 13.0 psi or 13.5 psi pre-game and were not tested first when the officials got to the locker room at halftime).

The last piece – which seems obvious, but I have not explicitly stated – is where the Patriots’ balls would have tested at halftime.

Using the same curve I assumed above (which is obviously imprecise), the Patriots’ balls would gain 0.45 psi in the first 8:20 they were indoors. This would put them at 11.40 psi (10.95+0.45 psi) after 8+ minutes indoors, which is one full psi below the range. If I were one of the refs, I’d probably have tested them well before that point, so we might be closer to 11 when they were tested.

Would be very interested in seeing how this scenario looks in the actual model and using the correct curves.

If the numbers for the Patriots’ and Colts’ balls in the simulation come out along these lines, it seems to me that this scenario would dovetail with the known facts and much of the leaked speculation (with the obvious exception of actions many suppose the Person of Interest may have taken in the men’s room or on the sidelines).

If this is the case, it seems that Mr. Kraft may well deserve his apology as it seems it would preclude wrongdoing by the Patriots.

Andrew
Andrew
2 years ago

Sam, in the 2006 video posted by i_j_m above, it appears that Green Bay worked on the balls with brushes within 15 minutes of (and possibly right up to) the time that they were handed off to the officials. This practice of working on them right down to the wire is consistent with what Belichick described in his press conference on Saturday.

Sam
Sam
2 years ago

It would still be interested to see the temperature loss in room temperature modeled. They are handed off in 15 minutes, meaning that that is a working minimum amount of time the balls could be checked. The actual time could be longer, depending on how many refs are doing the checking.

Whether air was added or removed after prep to adjust the pressure is also a big variable that has not been addressed. It was said that the pressure was adjusted after prep, but not how.

It would be interesting to do a field trial based on that video. One could epoxy a meat thermometer into the wall of the ball, inflate it, and monitor the temp. I think the insulating affect of the ball could inhibit the temperature rise inside the ball a bit. I’m interested to know how this was accounted for in the model.

rickm
rickm
2 years ago

Nice work. You predict a thermal time constant of 20 minutes in zero velocity air. I ran numbers using a simple lumped element model and predicted a time constant between 6 and 30 minutes. Never trust a computer simulation without attempting a back-of-the-envelope sanity check! My range assumed a range for h between 5 and 25 W/m^2 k and I assumed half of the football’s surface area was available for heat transfer. Has anyone seen any experimental data? seems easy to do…hot soak a football and monitor its pressure as a function of time.

The still air model is inappropriate to estimate the temperature at half time. The balls are being thrown, it’s raining on them, and the wind is blowing. I think it’s a good bet that the balls were equilibrated to the ambient air temperature well before half time but that is only an educated guess.

I also tried to estimate the time constant for a bag of footballs. My analysis was simple…I assumed the bag was a single lump with the thermal capacity of 12 footballs and the surface are was that of a rectangular box of footballs stacked in a 2x3x2 array, I forget what assumptions I made about the available surface areas but calculated that the bag had a time constant twice as long as an individual ball. I think all these simplifying assumptions lead to an underestimation of the real time constant (e.g., ignores insulation properties of the bag).

The time constant of the ball bag is critically important in any forensic investigation. It plays a role in what the average ball temperature might have been during the inspection, and, how close the balls were to the cold soaked temperature at halftime before the second inspection started. Having said that, the time constants shorten dramatically once you start moving the balls around and nobody recorded any numbers so it’s doubtful we’ll ever know what really happened.

Here’s another interesting speculation…the last NFL set of “facts” said one ball was seriously under the pressure limit, a few others were in the range of one PSI under, and the rest were a “few ticks” (tenths?) under or right on. When you scatter plot these values across equal time increments the data roughly fit the exponential decay return to equilibrium one would expect as the balls warm up. Furthermore, if the Colts’ balls were measured after the Patriots’ balls one would expect that they would be closer to the ambient temperature of the locker room when they were measured…..especially if they were taken out of the bag early in the process and “put in line” after the last Patriots ball (I’m picturing naïve league officials tossing them up in the air spinning them as they await their turn as they continue their “scientific” investigation).

When you compare the length of half time to the range of possible time constants it seems obvious that all of this is explained by basic physics. The most fascinating aspect to me has been the human element…the highly biased reaction from people oblivious to the science, the bungling of the celebrity “scientists”, the polarization of the Patriots lovers and haters, the debate if warming up the footballs with the grinders is cheating or good engineering…it’s been quite a show and I’m sure we’ll see more! I for one enjoy it and can’t wait to see what the storytellers come up with next!

I’m still hopeful that they conclude that one ball is way underinflated (beyond any limit explained by science, measurement error, etc.) and it is indeed the one the Colts were in possession of. A final twist that pins all of this on the Colts would be a storybook finish and good reading for everyone.

doug s
doug s
2 years ago

you do not take humidity into account unless it is a default condition of the air model.
humidity in a locker room is highly variable but normally on the humid side at least near the showers.
if air were compressed into a football from an ambient of 73deg.f. and 80% rh which seems reasonable and then taken outside to an ambient temperature of 50deg.f. what is the pressure change then? Under what conditions of inflation and use, if any, would there be condensation resulting in a pool of liquid water which would cause erratic behavior of the football in use?

Damon Tordini
Damon Tordini
2 years ago

Hi AB: good observation. I had heard that the game temperature likely dropped as it got darker, but I couldn’t find any concrete numbers for that, so I went with a conservative guess of a constant 51 degrees. That extra 10 degrees would almost certainly have made up the remaining difference.

Damon Tordini
Damon Tordini
2 years ago

Patsfan: that’s a very fair question. It may sound strange, but the number itself isn’t all that important, because there’s no way to know exactly what the Patriots staff is doing to these balls or for how long. All I had to do was pick a value that would warm the ball up in around 5 minutes or so, which it did, to see if the air inside the ball warmed up too (that was the question). I noted that the human body puts out a total of 70 W of heat to make it clear that someone’s hands could easily do 10 W.

Damon Tordini
Damon Tordini
2 years ago

Doug: this is a great find, thanks for posting it! It looks like my assumptions with the hands may have been too conservative. Those power tools almost certainly are delivering more heat than somebody rubbing the ball, but on the other hand, I’m not sure how early in the day the crew would be doing this.

Damon Tordini
Damon Tordini
2 years ago

Interesting point! I considered the effect that rain might have had. If the ball was wet, it almost certainly would have cooled down even faster. But, since this run of the simulation predicted they were already cooling down to just above the outside temperature before the half, I think the result would have been very similar.

Damon Tordini
Damon Tordini
2 years ago

Ray: it’s true that I didn’t account for rain in the simulation. I can’t find the Carnegie Mellon experiment you’re referring to; but, most likely, if the footballs were wet that would have gotten them to cool down even more quickly due to the evaporation effects of the rainwater.

Damon Tordini
Damon Tordini
2 years ago

Olimpio- thanks for the positive feedback. I will in fact be at SOLIDWORKS World in Phoenix! I’m conducting a Flow Simulation design challenge on Tuesday morning (Feb 10th at 10:30AM) for anybody who wants to get their hands on the program and see if they can come up with the best version of a car exhaust.

Check out the SOLIDWORKS World website for details.

Damon Tordini
Damon Tordini
2 years ago

Theo: if you notice the first graph in the article, that shows the temperature of the ball vs time. After about 30 minutes, the balls were still at 55 degrees, and in fact they didn’t get all the way to the field temperature even after an hour. All things being equal, the balls should take a similar length of time to warm back up, and if they were measured at halftime, we know it couldn’t have been more than a 15-minute delay. So, this scenario isn’t a full explanation.

Damon Tordini
Damon Tordini
2 years ago

kevin: see my reply above; the balls would have taken at least 30 minutes to cool down close to the field temperature, so there most likely wouldn’t have been enough time for them to warm back up at the half.

Damon Tordini
Damon Tordini
2 years ago

Andrew: interesting theory, it’s a possible explanation. As far as the pressure curve, it wouldn’t look exactly the same if starting at 13 or 13.5 psi instead of 12.5 psi (because the calculations are based on % changes in absolute temperature and pressure), but it would be similar.