|
|

In this article, we will see how to use the Windows Performance Monitor to keep track of SOLIDWORKS memory usage. This is a really great tool that is installed with Windows and will give us a more accurate look at how much memory SOLIDWORKS is using as well as how much residual memory has built up during our current session of SOLIDWORKS. Remember that as you open and close documents in SOLIDWORKS residual memory will build up and the only way to get it all dumped is to restart SolidWorks, the Performance Monitor is one way to check if it may be time for a restart. The steps for setting this up are easy and if you save your settings as shown in the end you will only have to do this once!
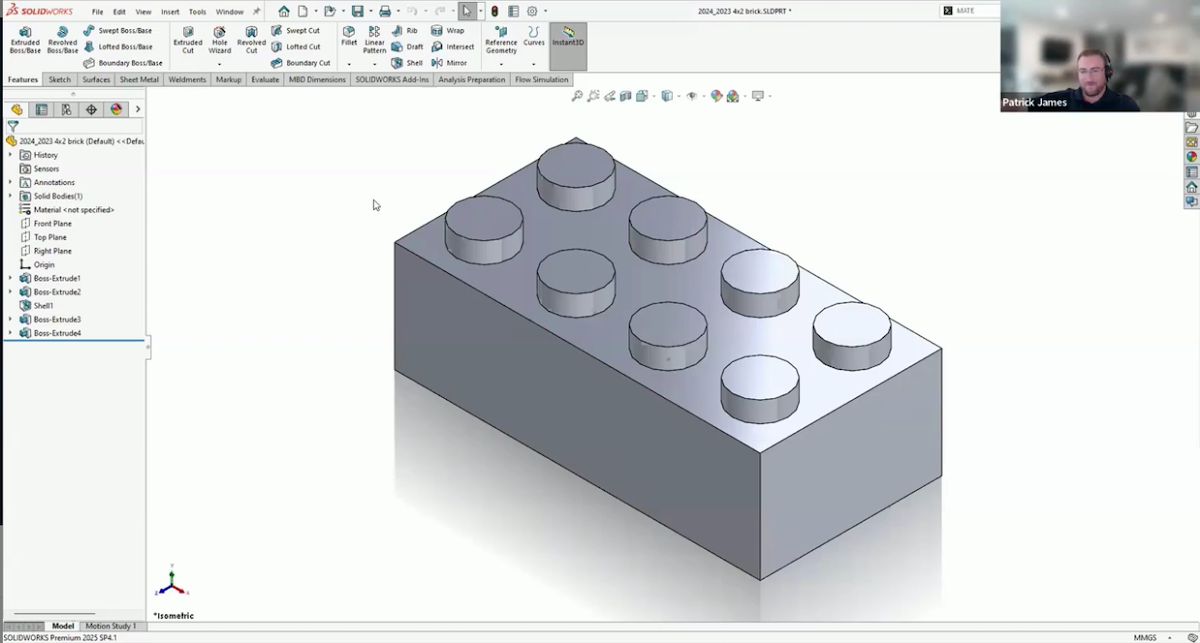
- First, SOLIDWORKS must be running in order to set this up.
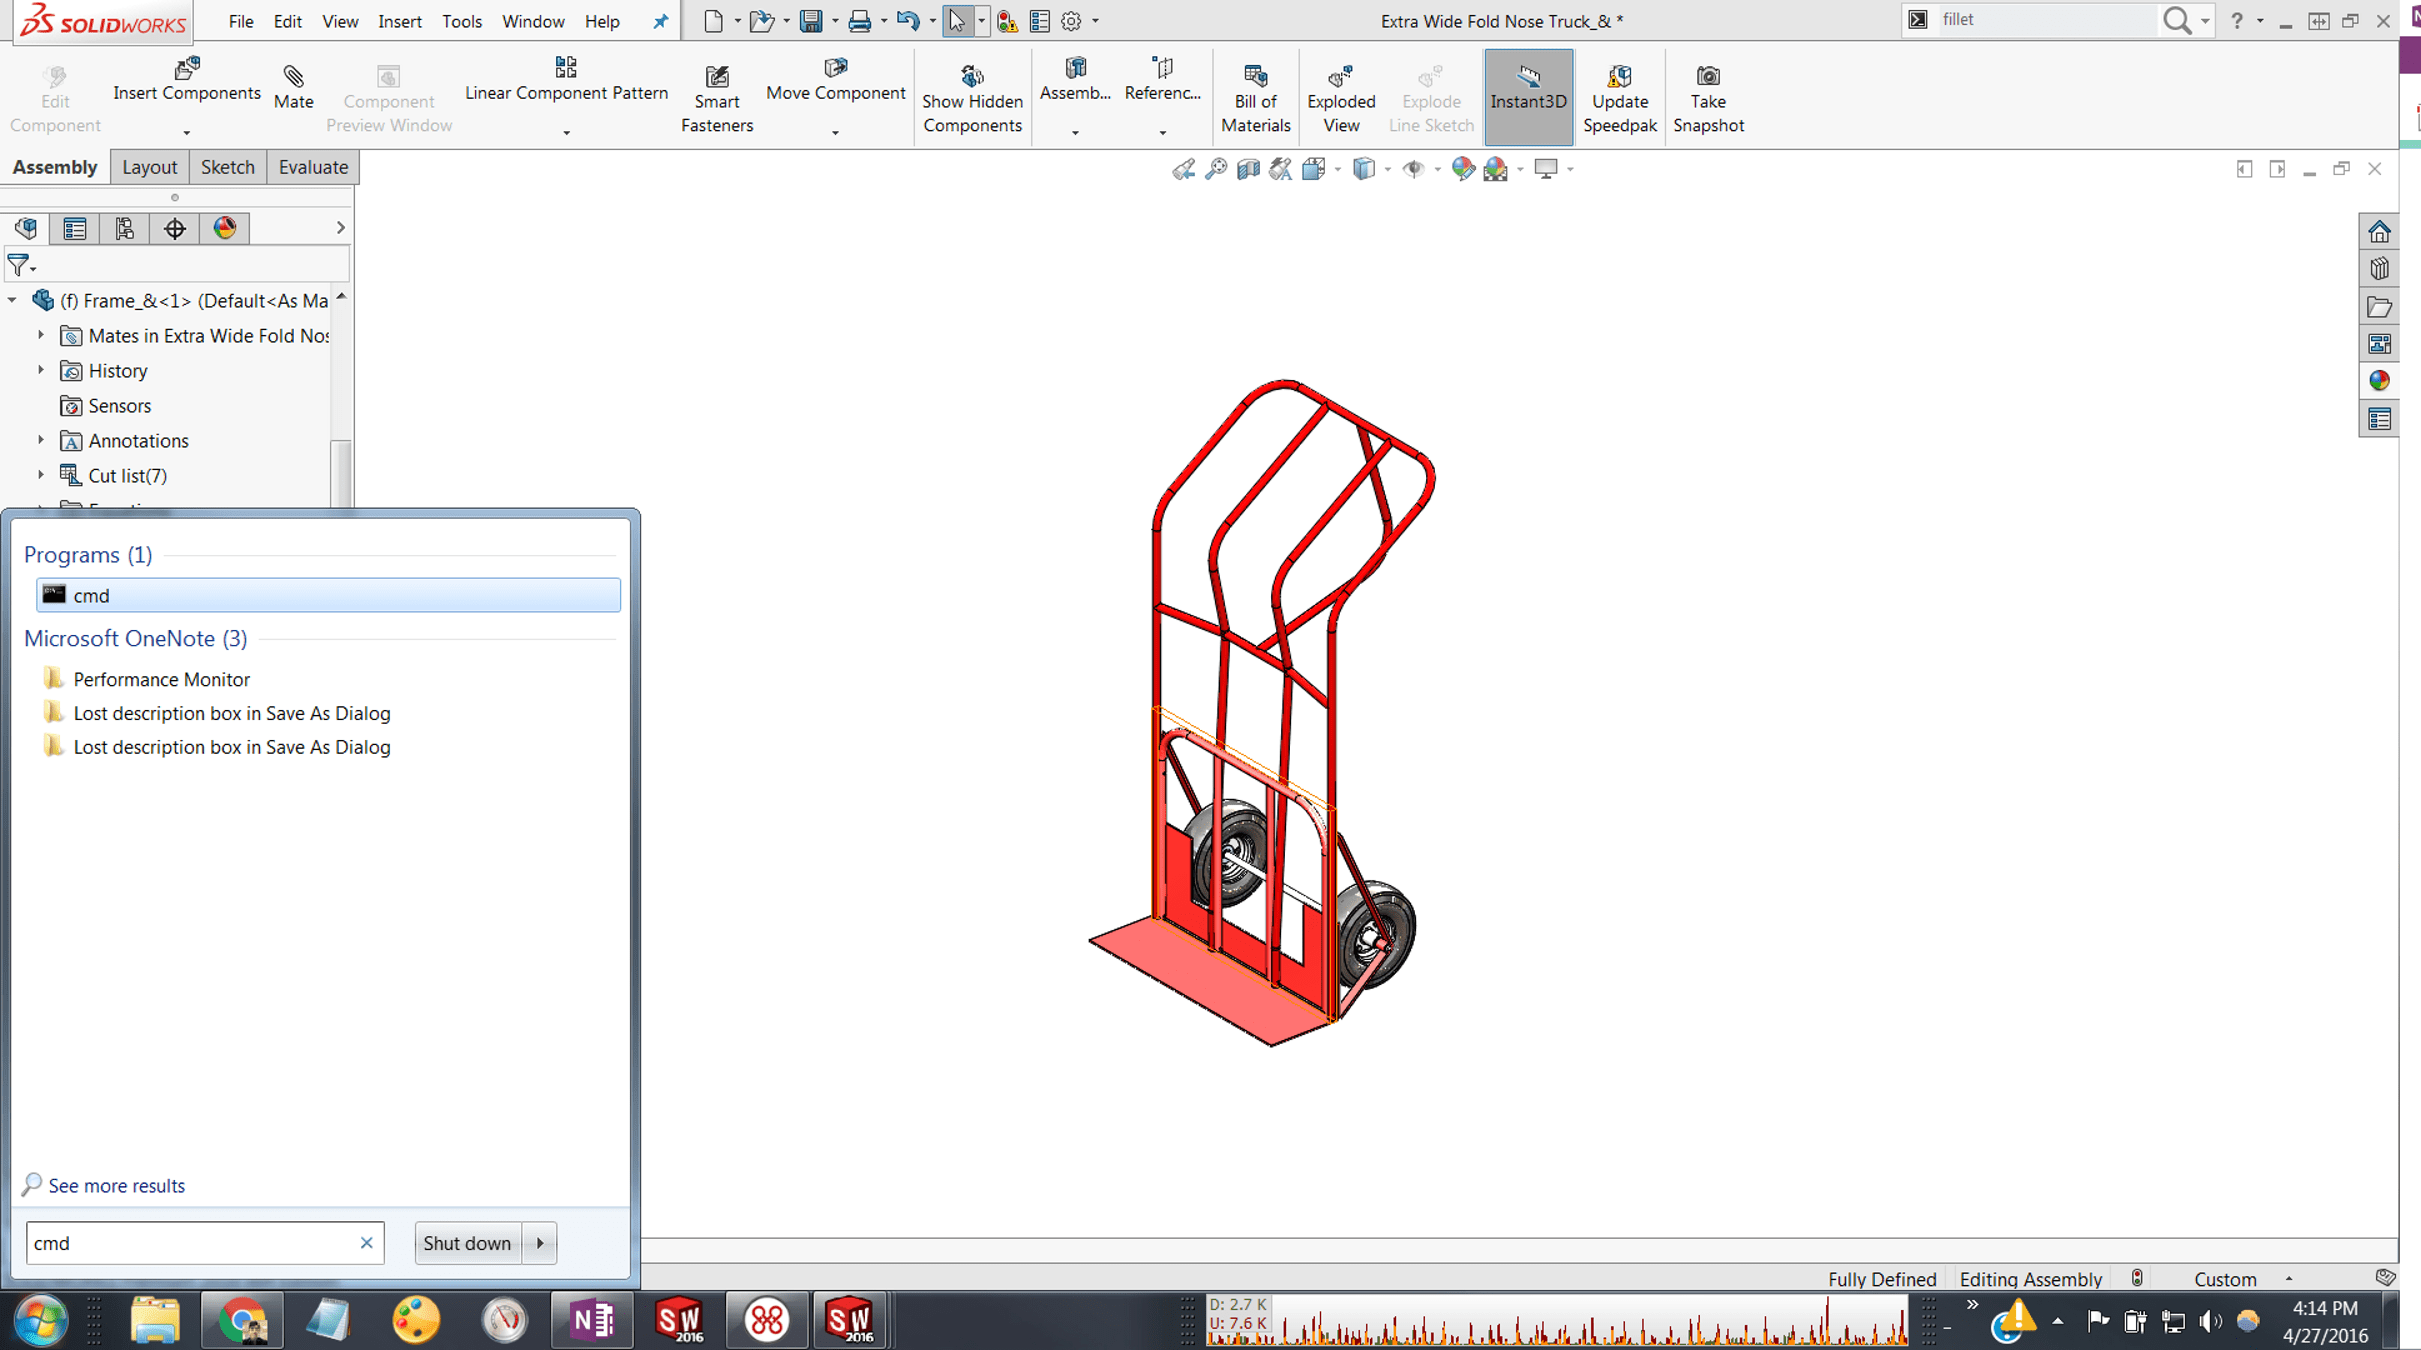
- Go to the Windows Start menu.
- In the Search Box type “perfmon /sys” and hit Enter to open the Performance Monitor in standalone mode (entering “perfmon” by itself will open the Performance Monitor with additional options to work with Data Collector Sets and Reports).
 |
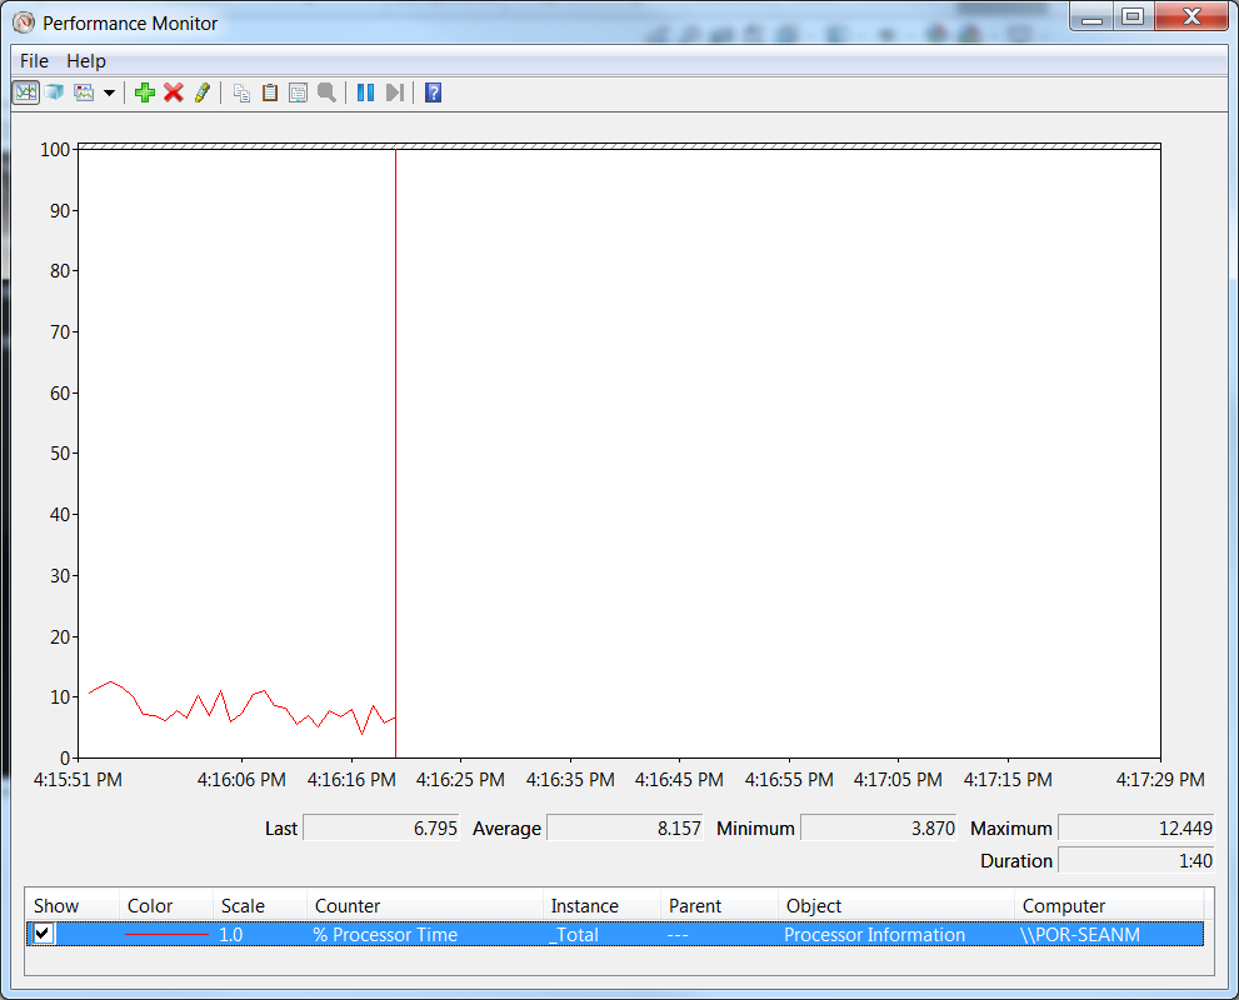
- With the Performance Monitor open you should see the default counter “%Processor Time”, you can have as many counters as you like, but for clarity, I will remove this one by selecting it and hitting Delete.
 |
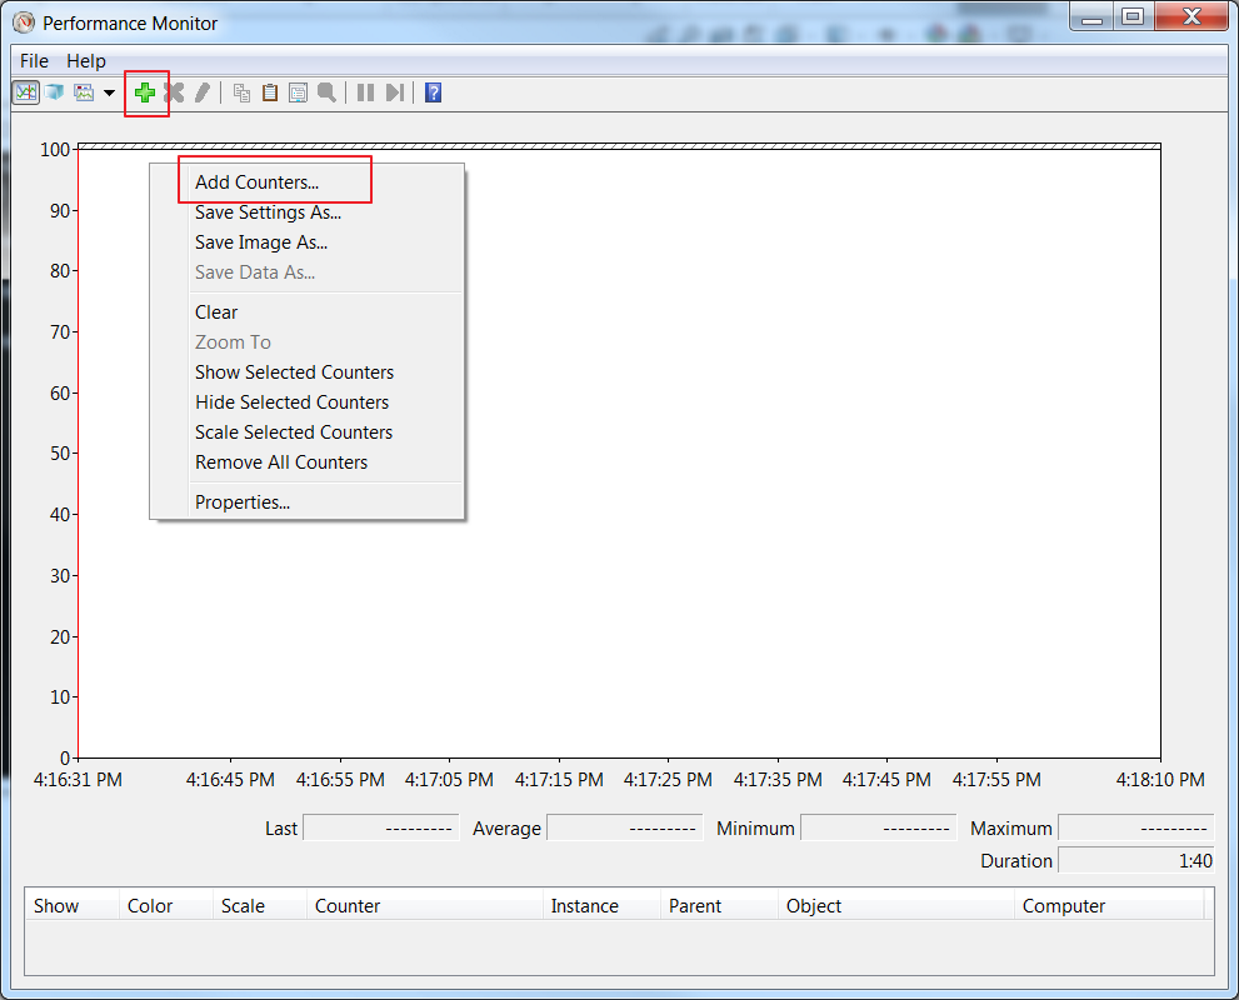
- Now it’s time to add the SOLIDWORKS counter, so click the Green Plus button on the toolbar or Right Click and select Add Counters…
 |
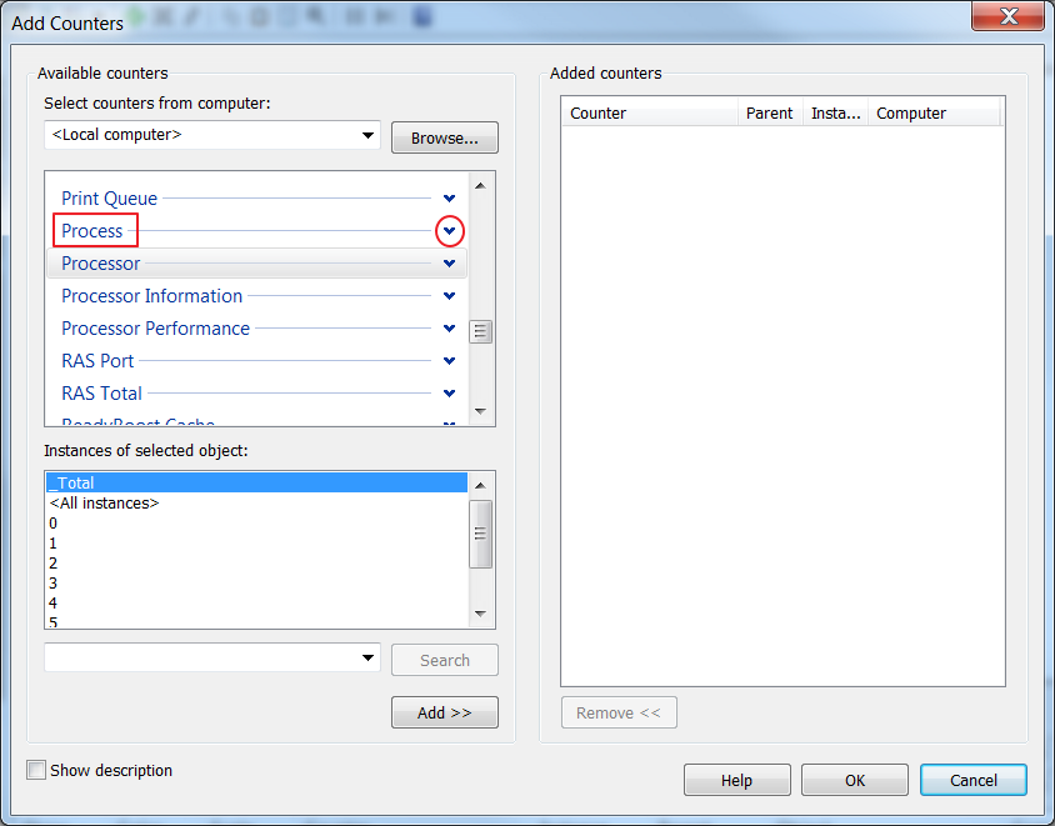
- Click the Drop-down Arrow next to “Process” in the counters box (you will probably have to scroll up to see “Process”).
 |
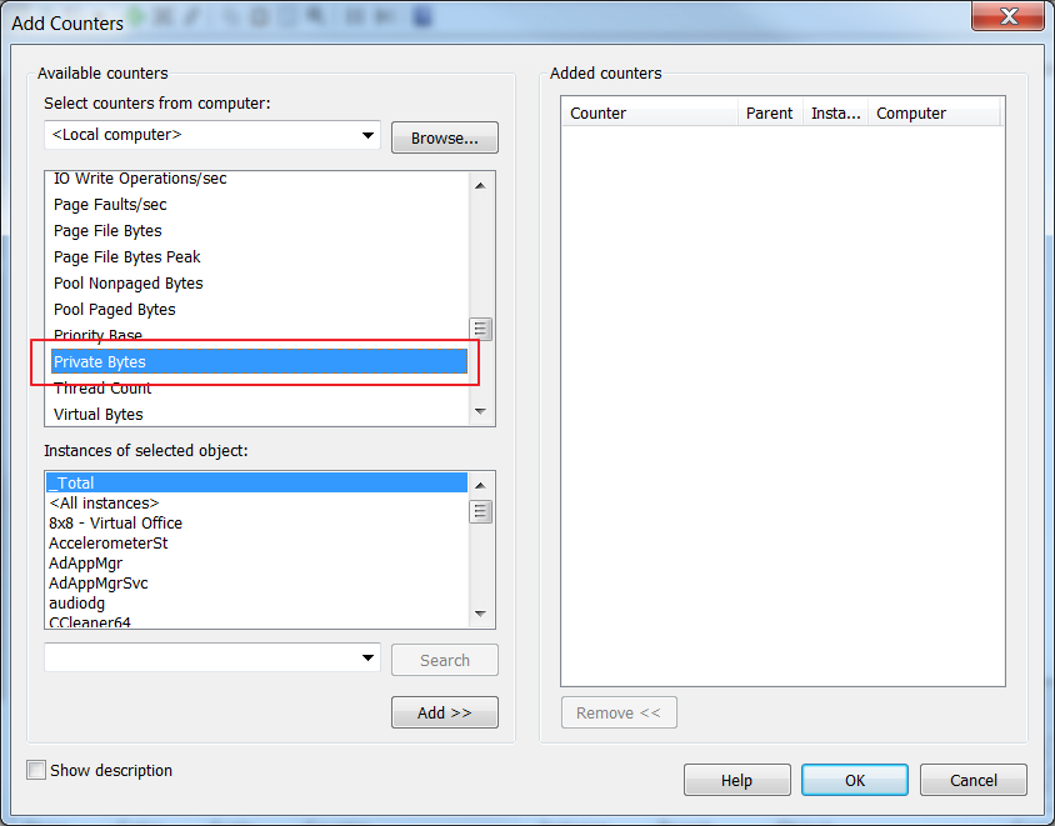
- Under “Process”, scroll down to Private Bytes and select it so that it is the only counter highlighted.
 |
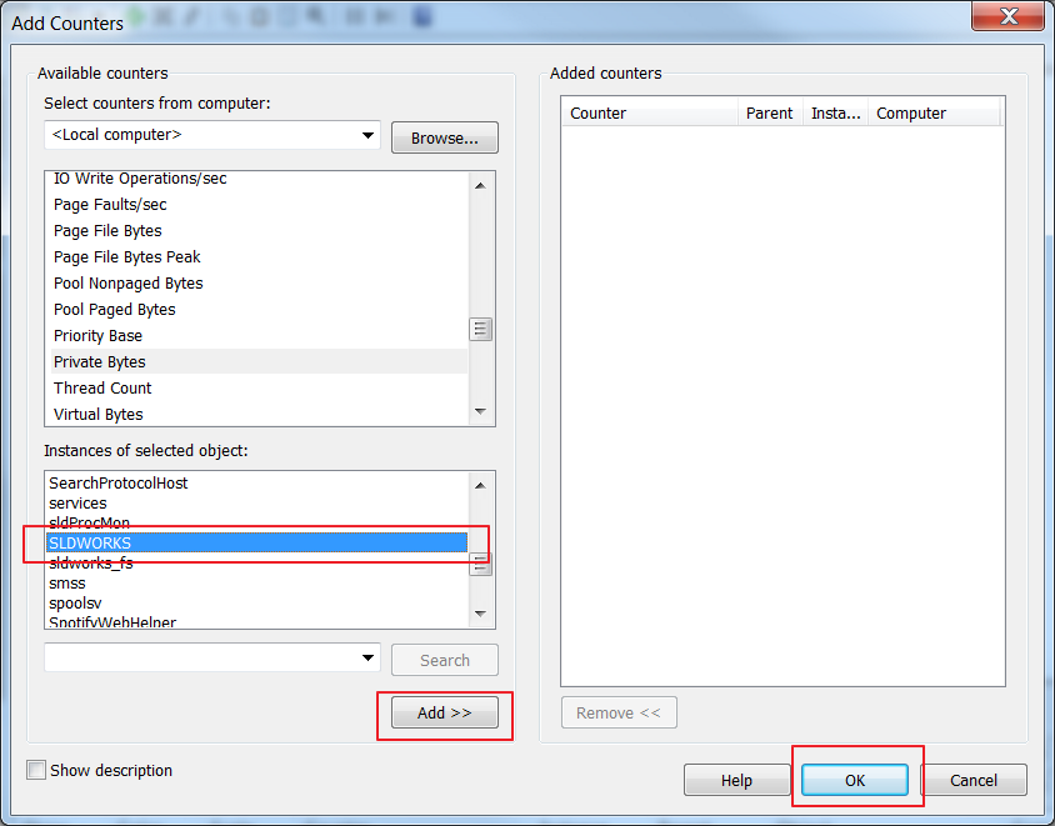
- In the “Instances of selected object” box scroll down to SLDWORKS and select it. Click Add >> and then OK.
 |
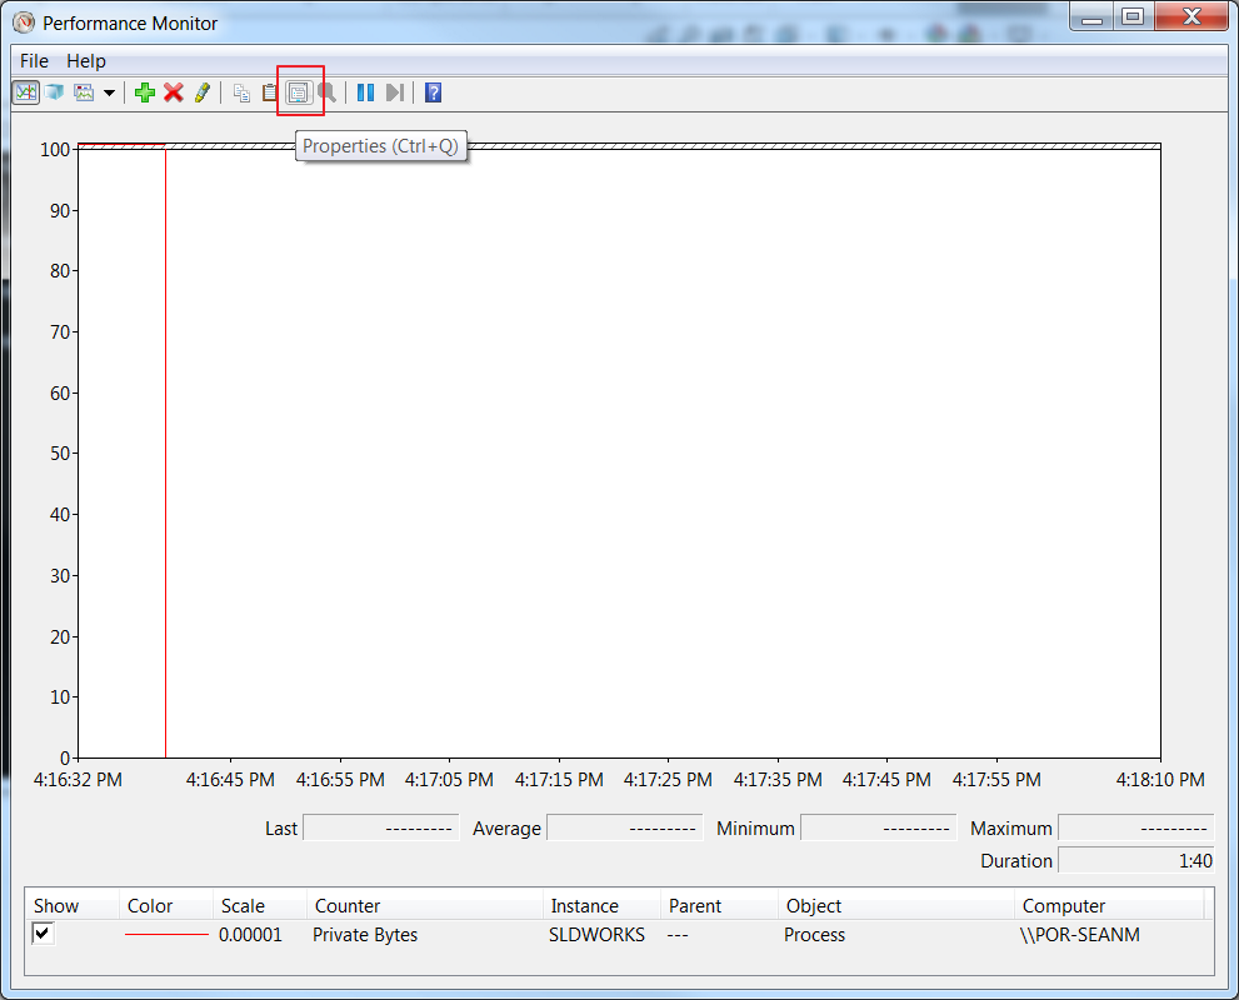
- Now before saving this we will adjust some Properties (the Properties button is found on the toolbar or can be opened with the shortcut CTRL+Q).
 |
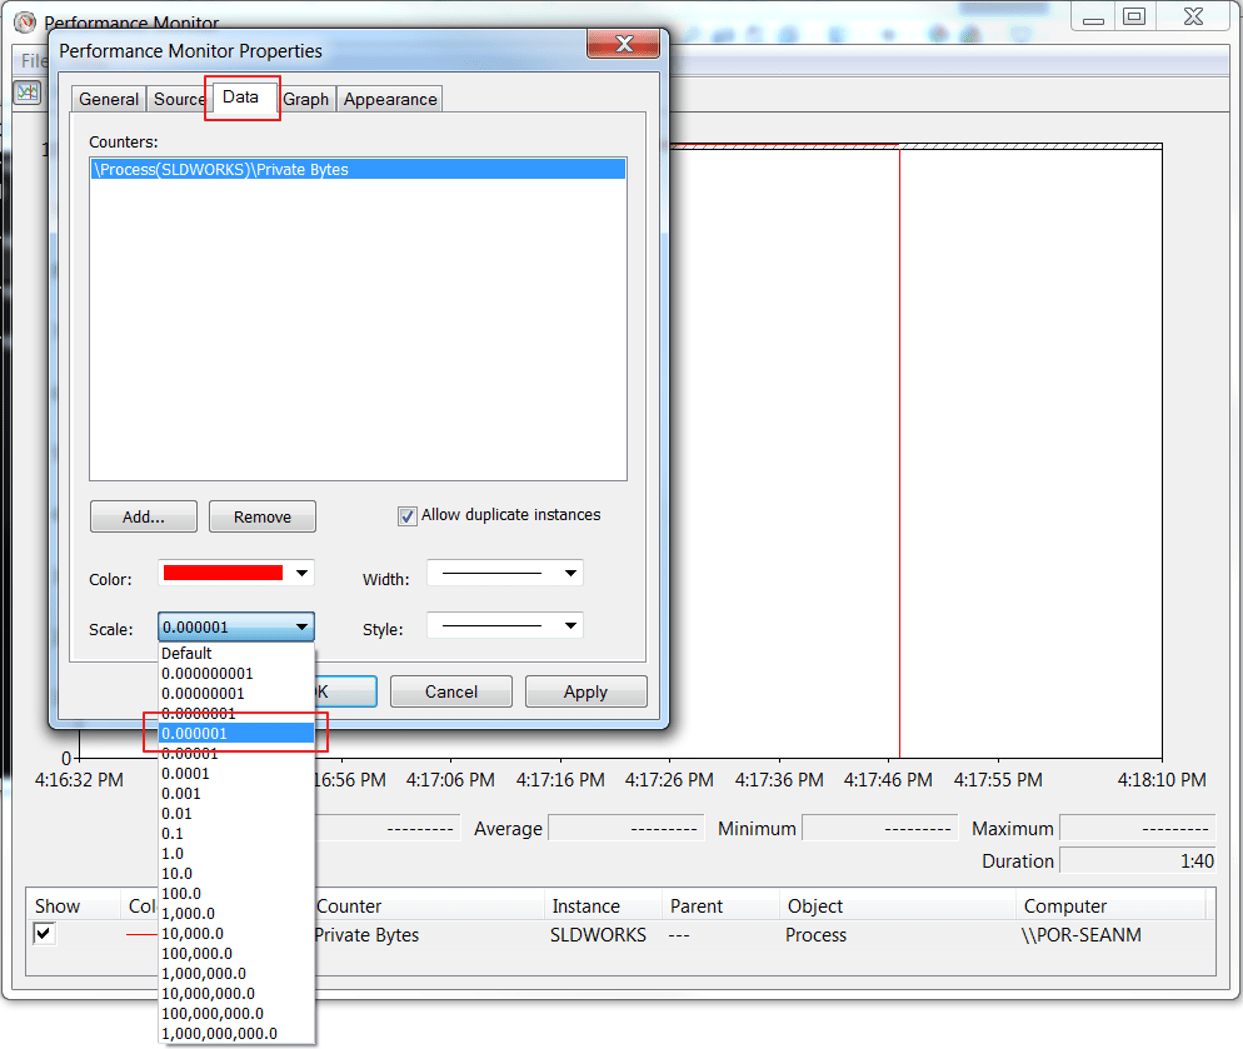
- In the Properties menu, go to the Data tab and adjust the scale of our counter to 000001 ( a scaling of 1E-6). This should be the 5th selection down and scale our counter so that our graph will use a scale of 1:1 Megabyte.
 |
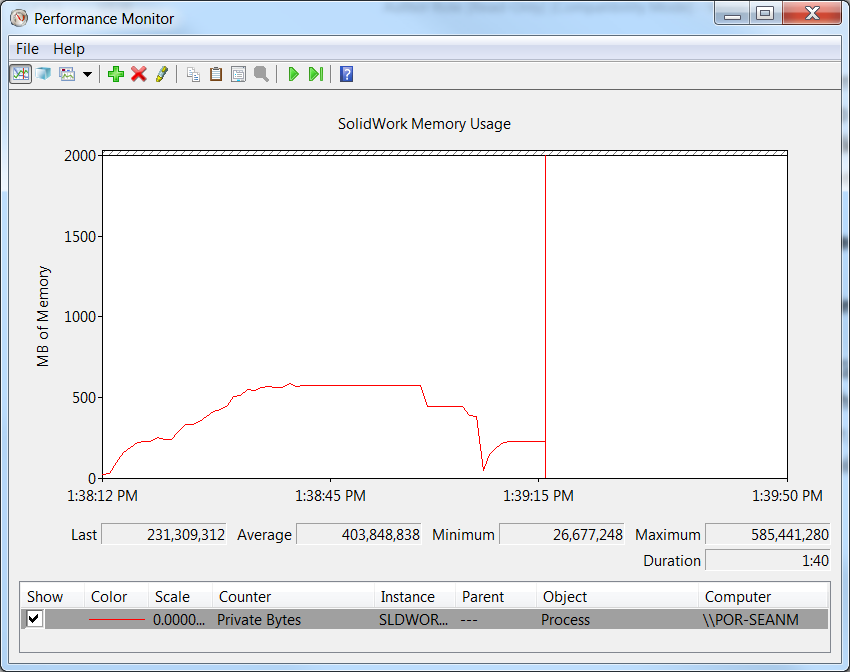
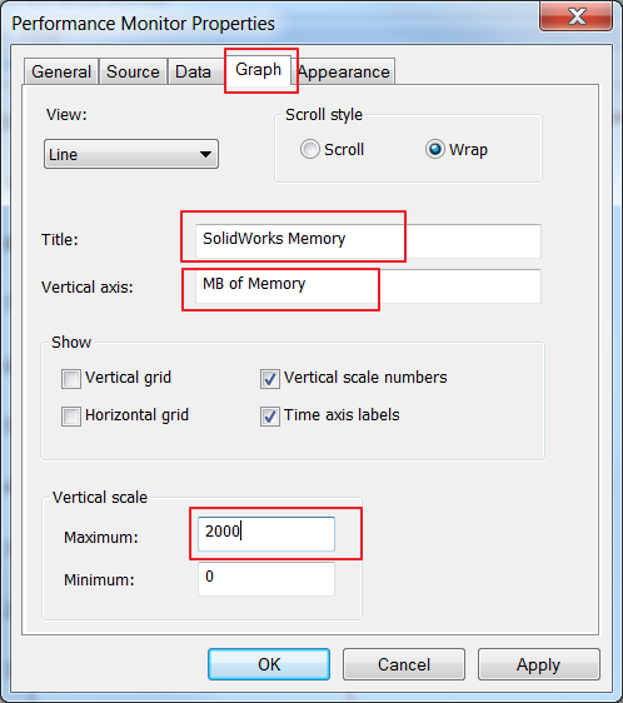
- Next, let’s go over to the Graph tab and type in the Title box SolidWorks Memory and then in the Vertical axis box MB of Memory. We will also set the Maximum to 2000, though you can set it to any value that you find appropriate keeping in mind that 1000 = 1 Gigabyte of memory.
 |
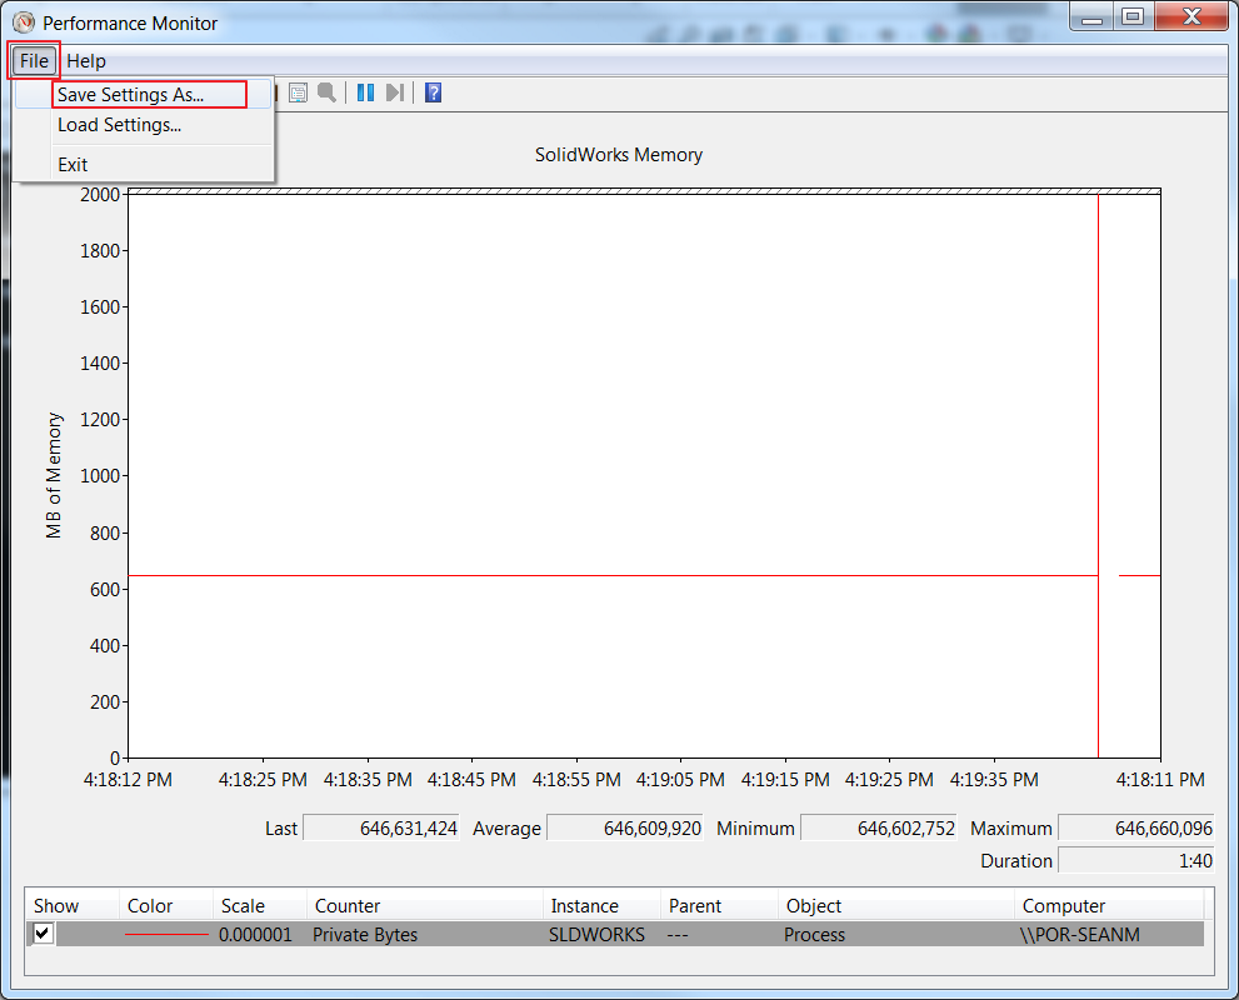
That’s pretty much it. Our last step will be to save our settings so we can call this up again later.
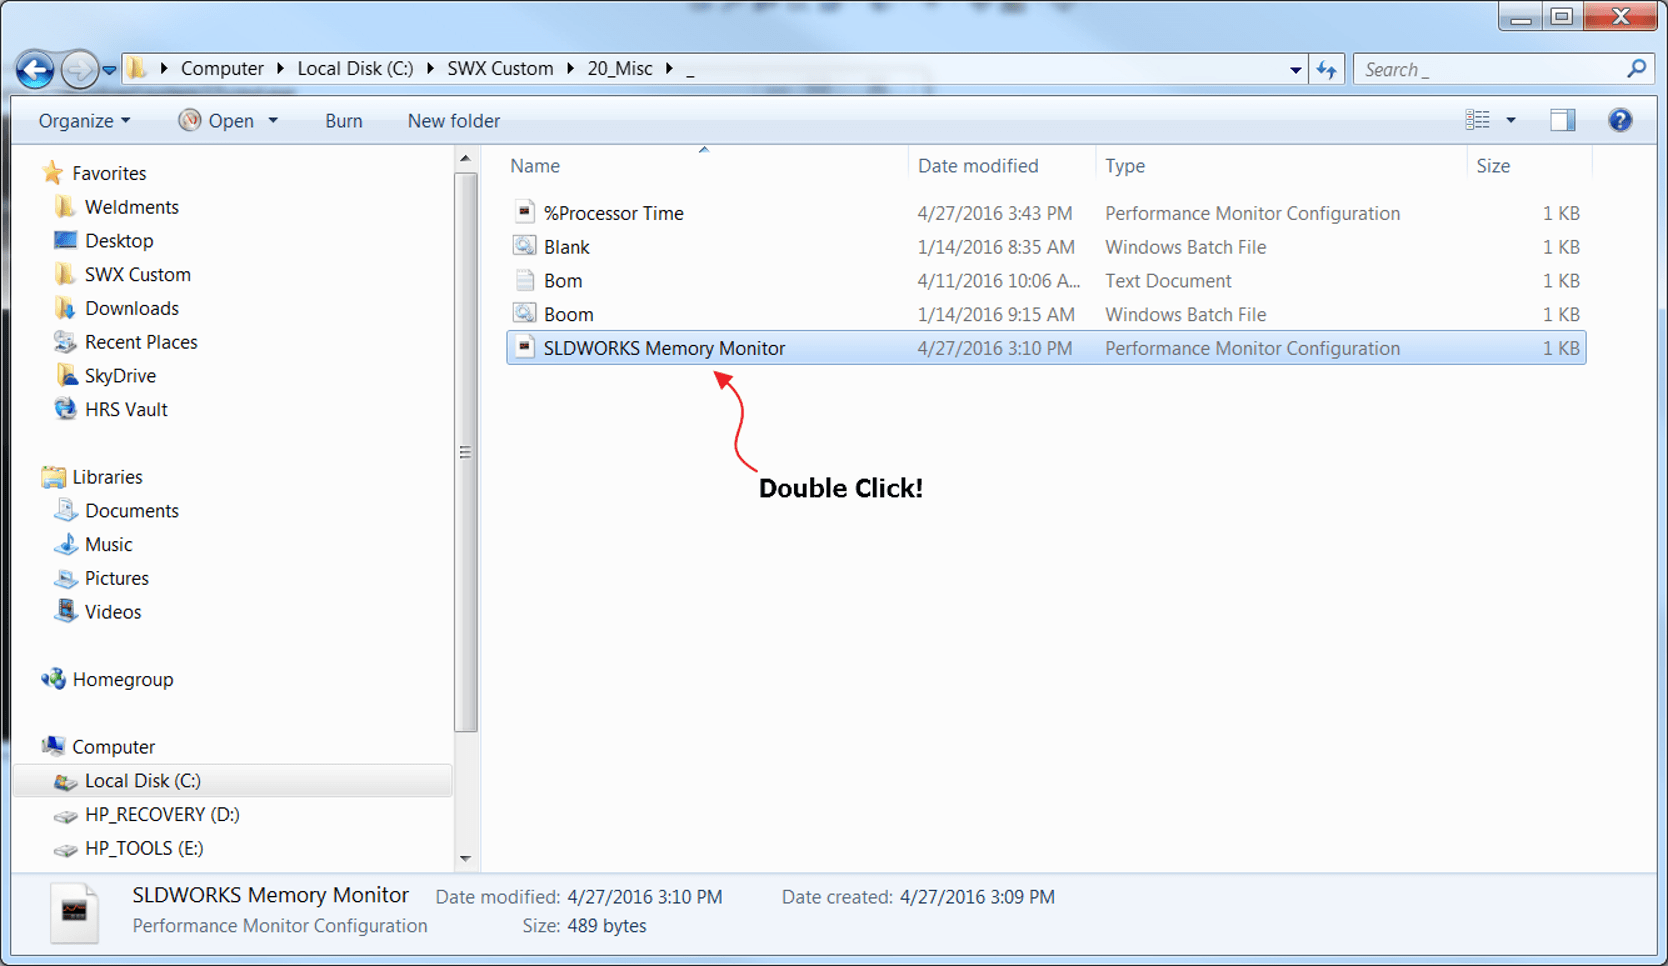
- To do this, go to File and select Save Settings As. Save this into a convenient location and the next time you want to check your SolidWorks Memory usage just give it a double click!
 |
 |
For more information and tutorials, check out our YouTube channel or contact us at Hawk Ridge Systems today!